
Fig. 2
- ID
- ZDB-IMAGE-151214-76
- Genes
- Publication
- Barreiro-Iglesias et al., 2015 - Serotonin Promotes Development and Regeneration of Spinal Motor Neurons in Zebrafish
- All Figures
- Figures for Barreiro-Iglesias et al., 2015
|
Fig. 2
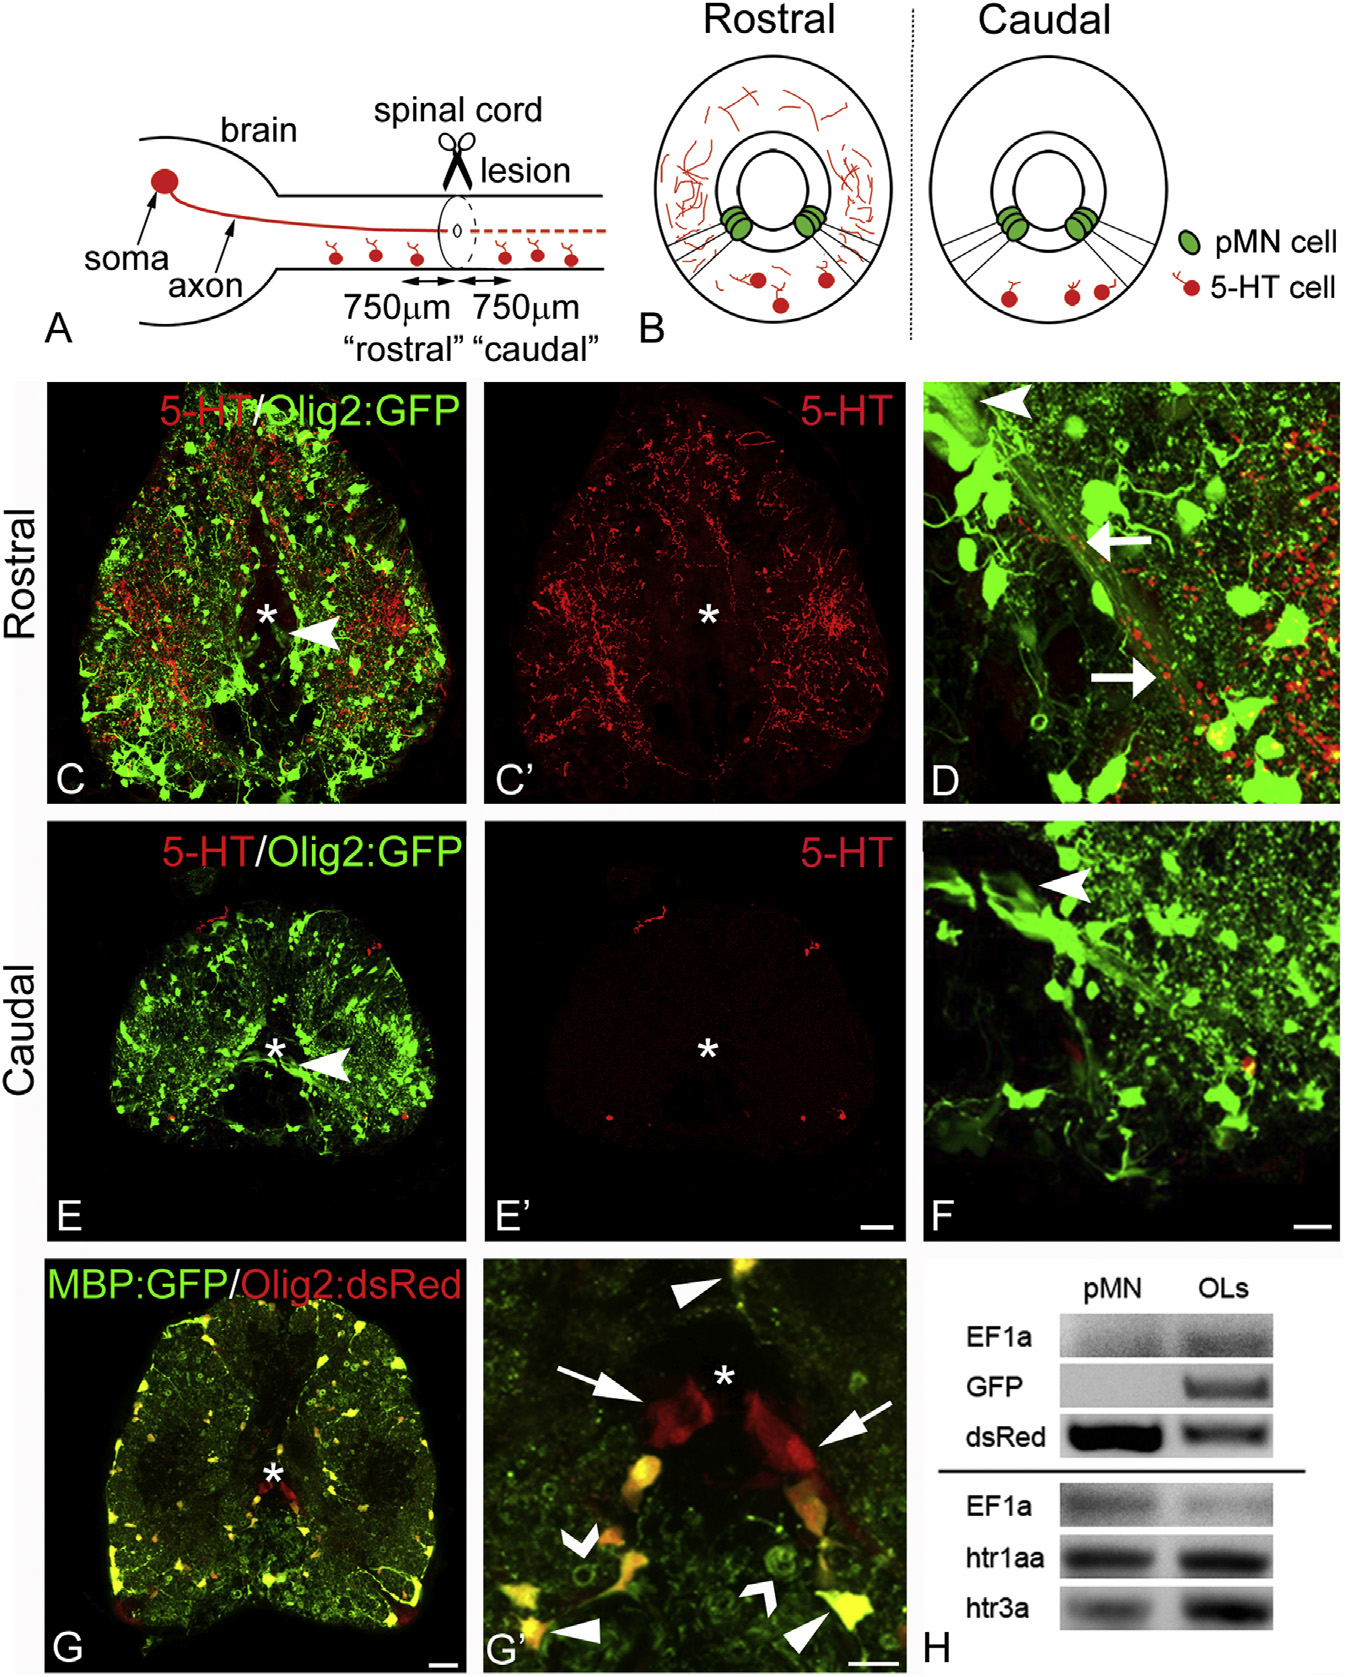
Serotonergic Axons Are Located in Close Proximity to Processes of pMN-like Adult Progenitor Cells Only Rostral to the Lesion
Spinal cross-sections are shown (dorsal is up; asterisk indicates central canal).
(A and B) Timeline and schematic representations of serotonergic axons in the injured spinal cord in lateral (A) and cross-sectional views (B), indicating the areas of analysis and density of serotonergic axons in relation to pMN-like ERGs.
(C–F) Overviews of 5-HT+ labeling in olig2:GFP fish rostral (C and C′) and caudal (E and E′) to the lesion are shown. In the ventro-lateral area, close apposition of serotonergic axons (red) with radial processes (green, arrows) of olig2:GFP+ pMN-like progenitor cells (arrowheads) are visible rostral (D), but not caudal (F), to the lesion.
(G and G′) Olig2:dsRed+/mbp:GFP ERGs (arrows), olig2:dsRed+/mbp:GFP+ oligodendrocytes (arrowheads), and myelin sheaths (open arrowheads) are indicated (G, overview; G′, detail).
(H) PCR after FACS indicates dsRed-only-labeled cells are enriched in the pMN-like ERG fraction, whereas GFP is only amplified in the oligodendrocyte fraction (OLs). EF1alpha is included for comparison. hrt1aa and hrt3a are expressed in adult pMN-like ERGs.
The scale bar in (E′) represents 50 µm for (C), (C′), (E), and (E′); in (F) represents 25 µm for (D) and (F); in (G) represents 25 µm; and in (G′) represents 10 µm. See also Figure S2.