
|
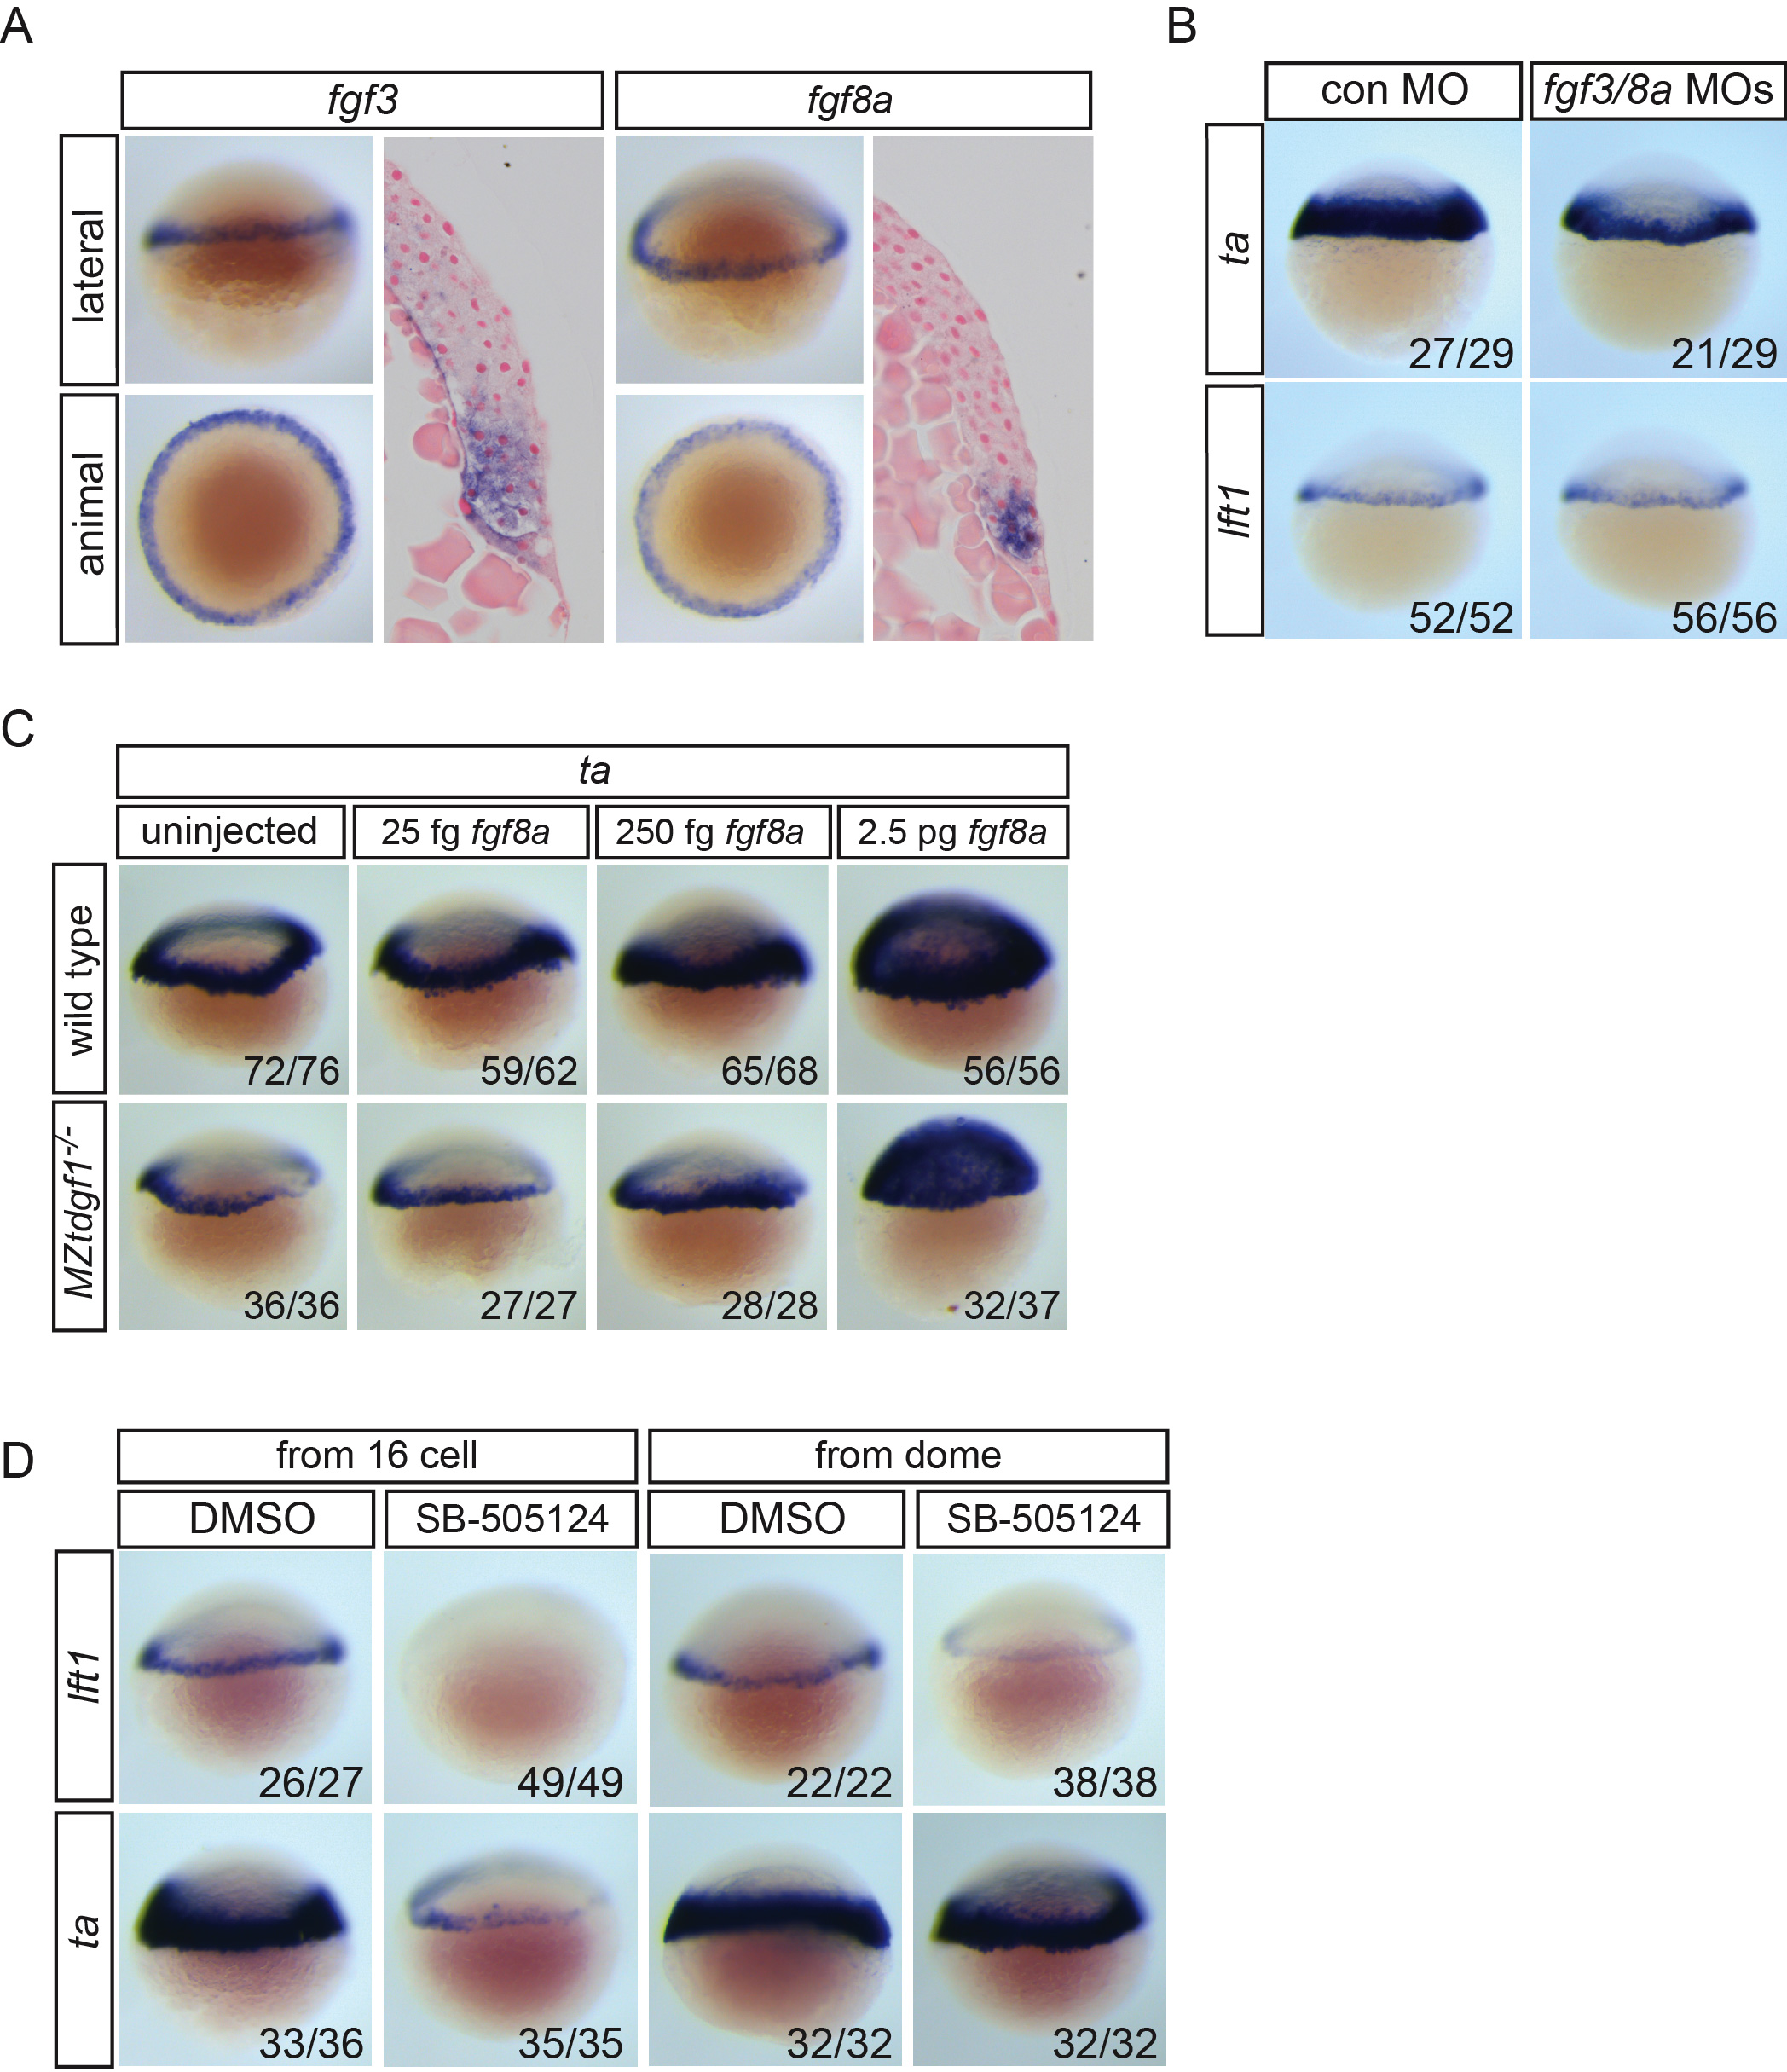
Fig. S1
Fgf signaling inhibition and Nodal signaling
(A) Expression of fgf3 and fgf8a in 40% epiboly embryos in the margin shown as WISH and sections.
(B) ta and lft1 expression in 40% epiboly embryos injected with control MO or a combination of fgf3 and fgf8a MOs.
(C) ta expression in wild type and maternal-zygotic (MZ) tdgf1-/- mutants. fgf8a mRNA (25 fg, 250 fg or 2.5 pg) was injected into wild type or MZtdgf1-/- mutant embryos, which were assayed by WISH for ta expression at 40% epiboly. ta is induced equally well in both backgrounds with 2.5 pg fgf8a mRNA.
(D) lft1 and ta expression following inhibition of Nodal signaling with SB-505124 from the 16-cell or dome stage. When inhibited from dome stage, lft1 expression is severely reduced, whereas ta expression is unaffected.
Reprinted from Developmental Cell, 35, van Boxtel, A.L., Chesebro, J.E., Heliot, C., Ramel, M.C., Stone, R.K., Hill, C.S., A Temporal Window for Signal Activation Dictates the Dimensions of a Nodal Signaling Domain, 175-185, Copyright (2015) with permission from Elsevier. Full text @ Dev. Cell