
IMAGE
Fig. 2
- ID
- ZDB-IMAGE-151130-35
- Genes
- Publication
- Swindell et al., 2015 - Crispld2 is required for neural crest cell migration and cell viability during zebrafish craniofacial development
- All Figures
- Figures for Swindell et al., 2015
Image
|
Figure Caption
Fig. 2
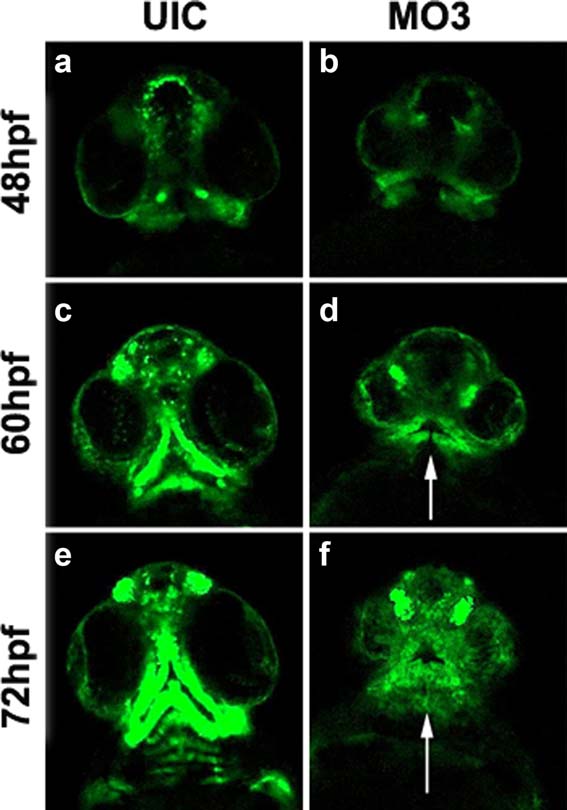
Aberrant oral cartilage in MO3 morphants. Time-lapse live cell imaging captures of sox10:GFP embryos showing migrating NCC cells at 48 (a, b), 60 (c, d), and 72 hpf (e, f). UIC (a, c, and e) and MO3-injected embryos (b, d, and f) showing a ventral view of migrating NCCs. White arrows point to loss of normal migration and abnormal formation of presumptive cartilage elements.
Figure Data
Acknowledgments
This image is the copyrighted work of the attributed author or publisher, and
ZFIN has permission only to display this image to its users.
Additional permissions should be obtained from the applicable author or publisher of the image.
Full text @ Genesis