
Fig. 5
- ID
- ZDB-IMAGE-151125-73
- Genes
- Publication
- Okuda et al., 2015 - A zebrafish model of inflammatory lymphangiogenesis
- All Figures
- Figures for Okuda et al., 2015
|
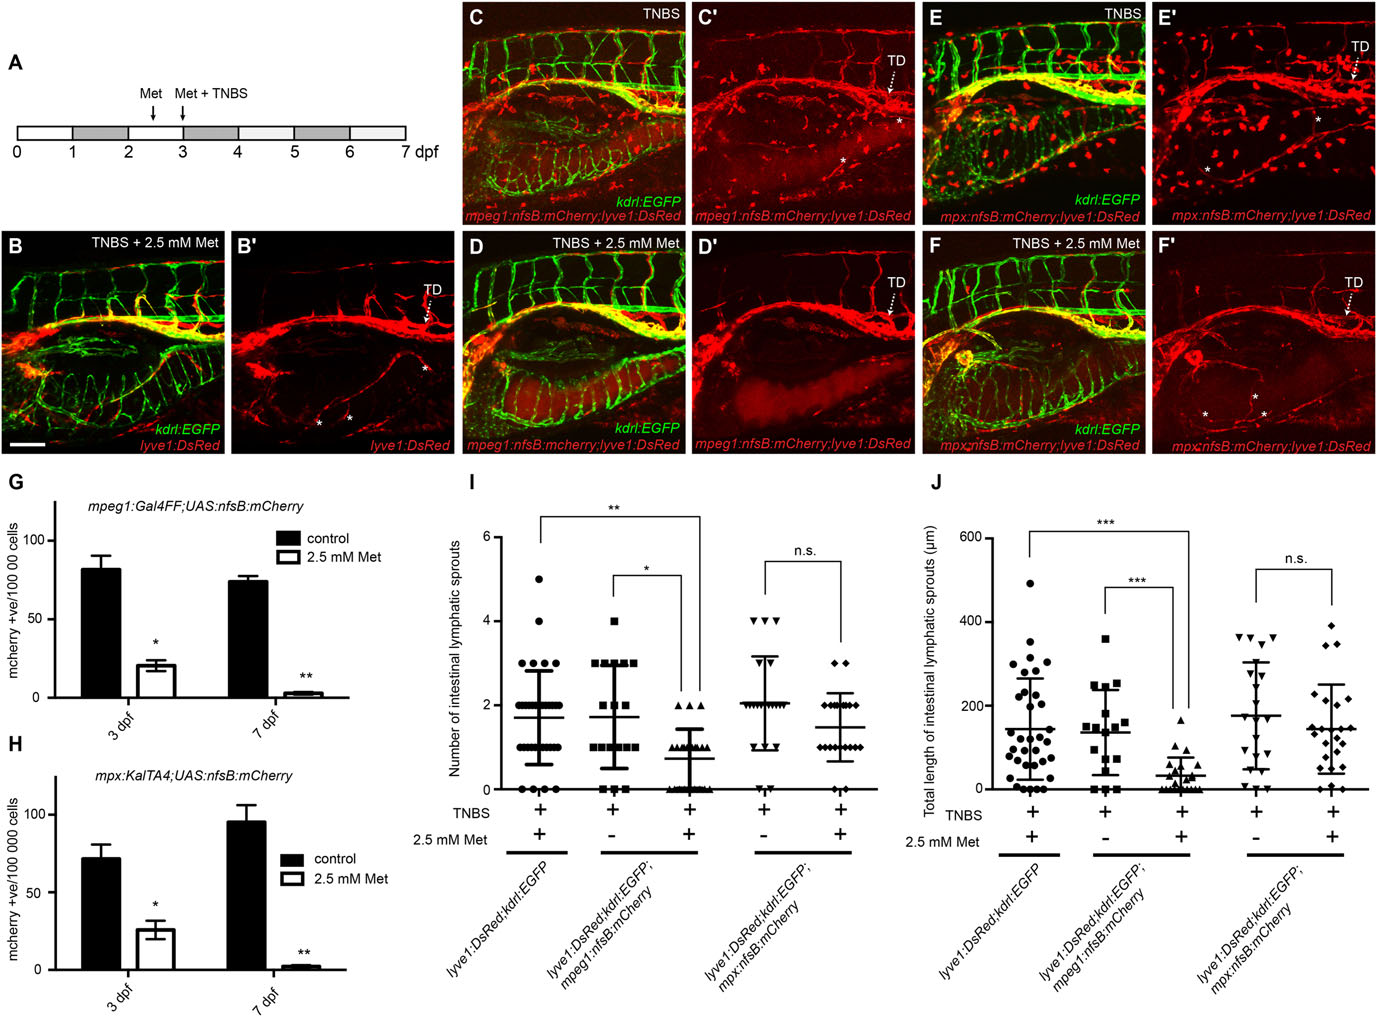
Fig. 5
Macrophages are required for intestinal inflammatory lymphangiogenesis. (A) Schema outlining metronidazole and TNBS treatments. (B) Lateral image of the intestine in 7dpf lyve1:DsRed2; kdrl:EGFP larvae exposed to TNBS+2.5mM metronidazole (Met). (C,D), Lateral image of the intestine in 7dpf lyve1:DsRed2;kdrl:EGFP;mpeg1:Gal4FF;UAS:nfsB:mCherry larvae exposed to TNBS (C) and TNBS+2.5mM metronidazole (D). (E,F), Lateral image of the intestine in 7dpf lyve1:DsRed2;kdrl:EGFP;mpx:KalTA4;UAS:nfsB:mCherry larvae exposed to TNBS (E) and TNBS+2.5mM metronidazole (F). (B2-F2) shows expression in the DsRed/mCherry channel only. Asterisks indicate intestinal lymphatic sprouts (ILSs). (G,H) FACS analysis of mCherry-positive cell counts from TNBS-treated (control) and TNBS+2.5mM metronidazole-treated 3 and 7dpf mpeg1:Gal4FF;UAS:nfsB:mCherry larvae (G) or mpx:KalTA4;UAS:nfsB:mCherry larvae (H) (ne3, each replicate contains 30–80 larvae). (I,J) Quantification of ILS number (I) and total ILS length (J) (ne17). Error bars, ±s.d. n.s. P>0.05, *P<0.05, **P<0.01, ***P<0.001, by unpaired t-test (G,H) or by one-way ANOVA with Tukey′s multiple comparison test (I,J). TD, thoracic duct. Scale bar: 100µm.