
|
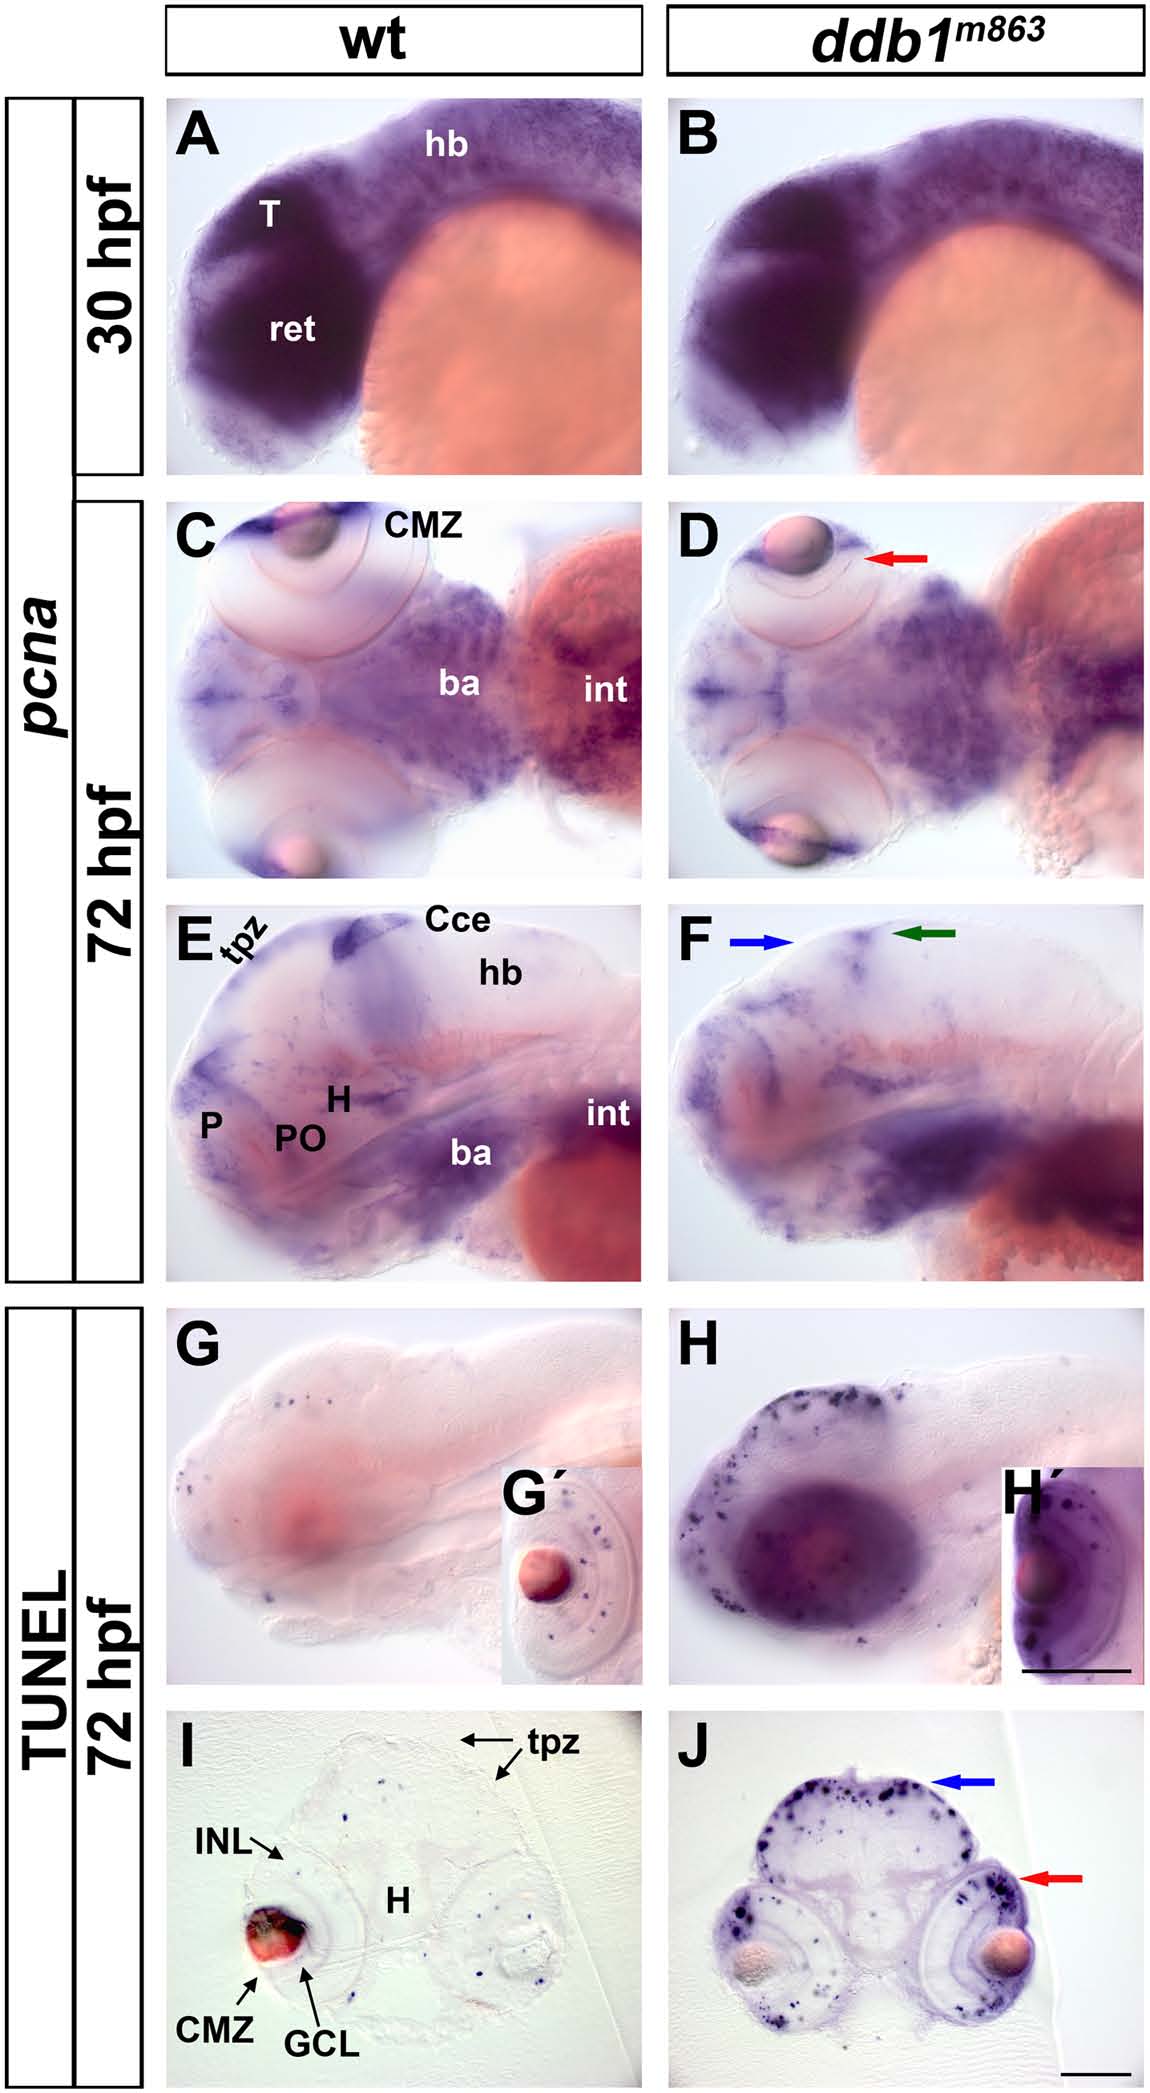
Fig. 4
Enhanced apoptosis in proliferation regions of the ddb1m863 mutant CNS.
(A-F) The pcna expression pattern in ddb1m863 mutants and wild type siblings at 30 hpf (A-B) and 72 hpf (C-F). (G-J) TUNEL assay for apoptosis in ddb1m863 mutants (H-H′, J) and wild type siblings (G-G′, I) at 72 hpf. Embryos or larvae in lateral (A-B, E-H) and ventral views (C-D). Cross sections (20 µm; I-J) from larvae by TUNEL assay. Arrows represent affected pcna-expressing cells or enhanced apoptotic cells in the retina (D, J; red), pretectal region (F, J; blue), and cerebellum (F; green). Abbreviations used: ba, branchial arches; CMZ, ciliary marginal zone; Cce, cerebellum; GCL, ganglion cell layer; hb, hindbrain; H, hypothalamus; INL, inner nuclear layer; int, intestine; P, pallial proliferation zone; PO, preoptic area; tpz, tectal proliferation zones; Anterior towards the left. Scale bars in H′ for G′ and H′, in J for all of others: 100 µm.