
Fig. S2
- ID
- ZDB-IMAGE-150618-6
- Genes
- Publication
- Marjoram et al., 2015 - Epigenetic control of intestinal barrier function and inflammation in zebrafish
- All Figures
- Figures for Marjoram et al., 2015
|
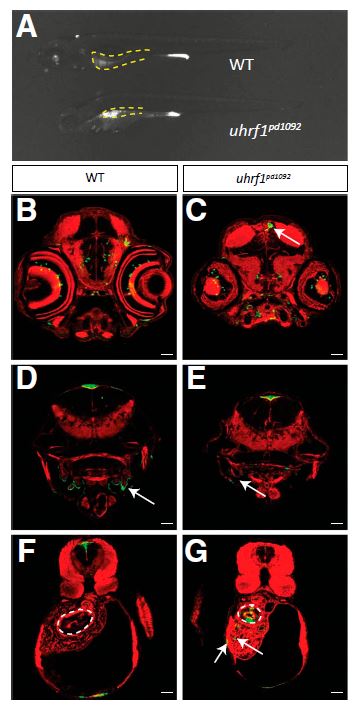
Fig. S2 TgBAC(tnfa:GFP) expression in WT and uhrf1pd1092 larvae. (A) Whole-mount image of WT and uhrf1pd1092 mutants showing the specificity of TgBAC(tnfa:GFP) up-regulation in the intestine (yellow dotted lines). (B–G) Confocal images of cross-sections stained with phalloidin (red). (B and C) Both WT and mutant larvae have GFP-positive cells in the brain and eye. The white arrow (C) points to an area of increased GFP expression in the mutant. (D and E) WT and mutant larvae express TgBAC(tnfa:GFP) in the gills (arrows). (F and G) Scattered GFP-positive cells are detected in the liver of mutants (G) but not in WT siblings. White dotted lines encircle the anterior gut; mutants display elevated TgBAC(tnfa:GFP) in the epithelium. (Scale bars: 50 µm.)