
|
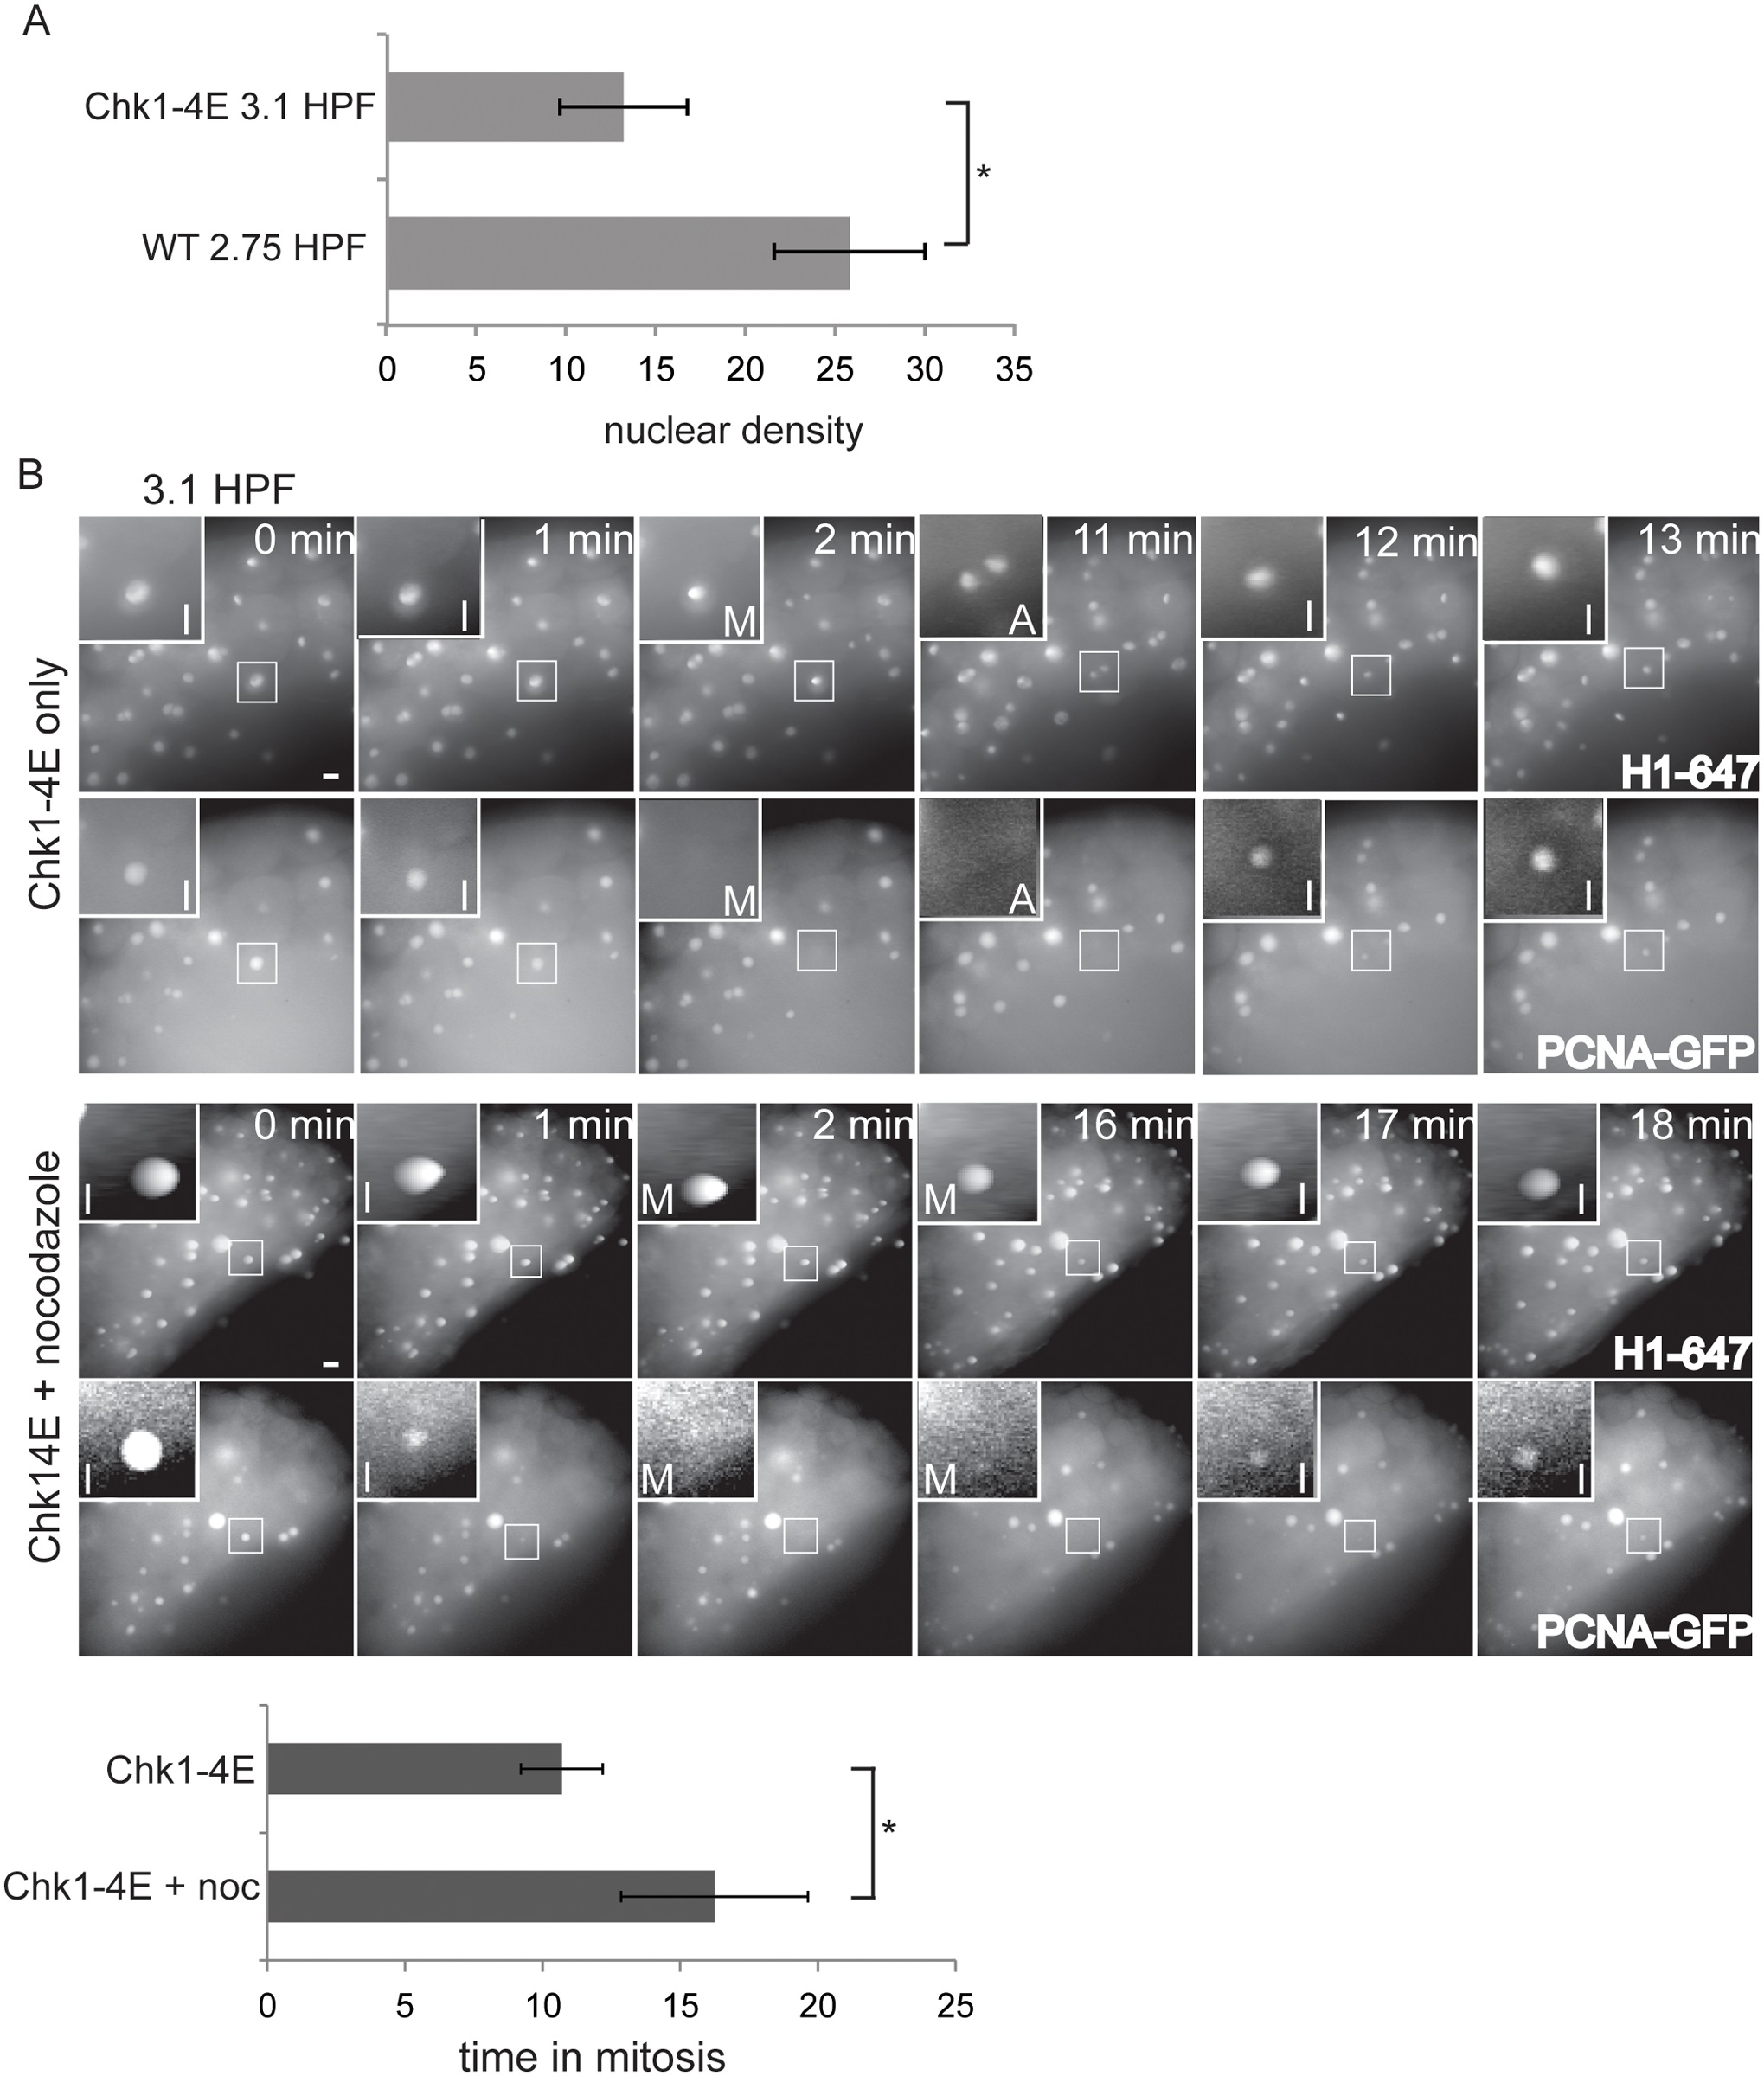
Fig. 4
SAC acquisition is independent of the N:C ratio.
(A) Nuclear density was measured for embryos injected with Alexa 647-Histone H1 and PCNA-GFP proteins and Chk1-4E mRNA at 3.1 HPF, or embryos injected only with H1-647 and PCNA-GFP proteins at 2.75 HPF. Error bars are S.D.; ne11; Pd0.001. (B) Embryos were injected with Alexa 647-Histone H1 and PCNA-GFP proteins and Chk1-4E mRNA, treated with or without nocodazole at 3.1 HPF, then imaged live. Images show cell cycle progression based on Histone H1 and PCNA-GFP. Insets are displayed with higher contrast settings to show nuclear morphology as in Fig. 1. In the montage, time between metaphase and the next interphase is 10 min without nocodazole and 16 min for nocodazole-treated embryos. Graph shows average length of mitosis for each condition (ne13 from four independent experiments). Error bars indicate S.D.; * Pd 0.001; two-tailed Student’s t test; scale bars 20 µm.