
Fig. 2
- ID
- ZDB-IMAGE-150526-2
- Genes
- Antibodies
- Publication
- Ye et al., 2015 - glucagon is essential for alpha cell transdifferentiation and beta cell neogenesis
- All Figures
- Figures for Ye et al., 2015
|
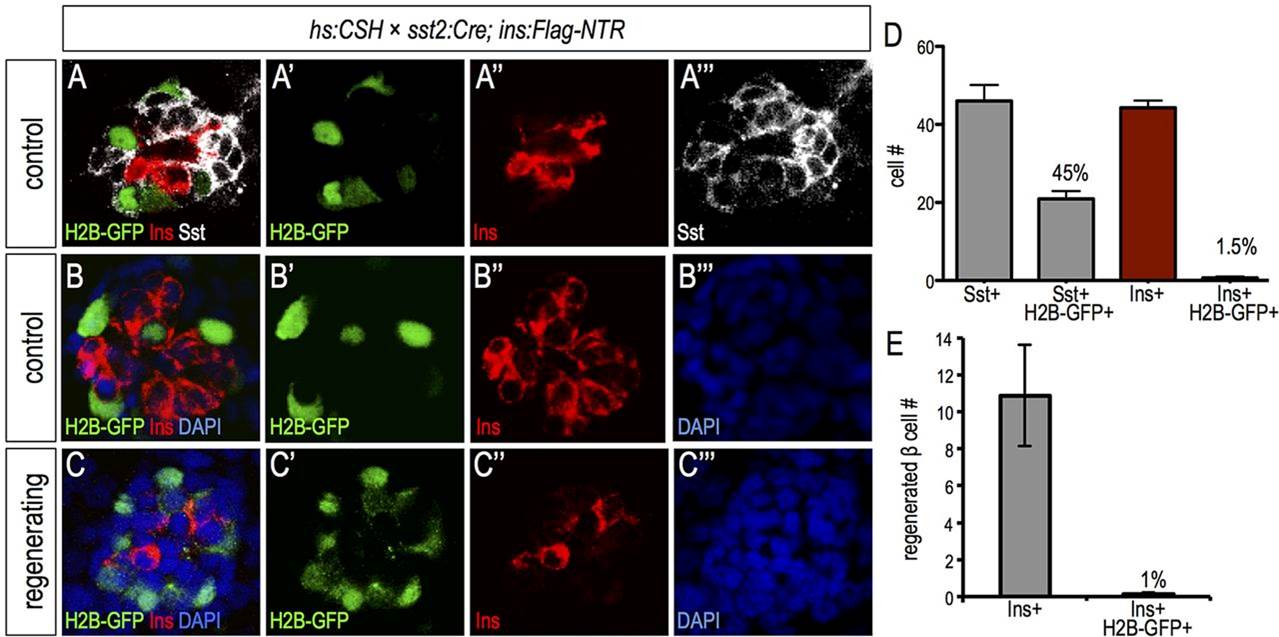
Fig. 2
δ cells, but not regenerating β cells, are lineage marked by sst2:Cre. (A-A′′′) Merged and single-channel images of 5-dpf Tg(sst2:Cre); Tg(hs:CSH); Tg(ins:Flag-NTR) islets that were heat shocked at 3dpf and stained for GFP (green), insulin (red) and somatostatin (white). Somatostatin+ δ cells are labeled by H2B-GFP. (B-C′′′) Merged and single-channel images of 5-dpf non-ablated (B) or 1dpa (C) Tg(sst2:Cre); Tg(hs:CSH); Tg(ins:Flag-NTR) islets that were heat shocked at 3dpf and stained for GFP (green), insulin (red) and DNA (blue). (D) Quantification of total somatostatin+, somatostatin+/H2B-GFP+, insulin+, and insulin+/H2B-GFP+ cells in non-ablated 5-dpf Tg(sst2:Cre); Tg(hs:CSH); Tg(ins:Flag-NTR) islets. 45% of somatostatin+ cells and 1.5% of insulin+ cells are marked by sst2:Cre (n=15). (E) Quantification of insulin+ and insulin+/H2B-GFP+ cells in 5-dpf regenerating islets. 1% of insulin+ cells are marked by sst2:Cre (n=9).