
|
Fig. 2
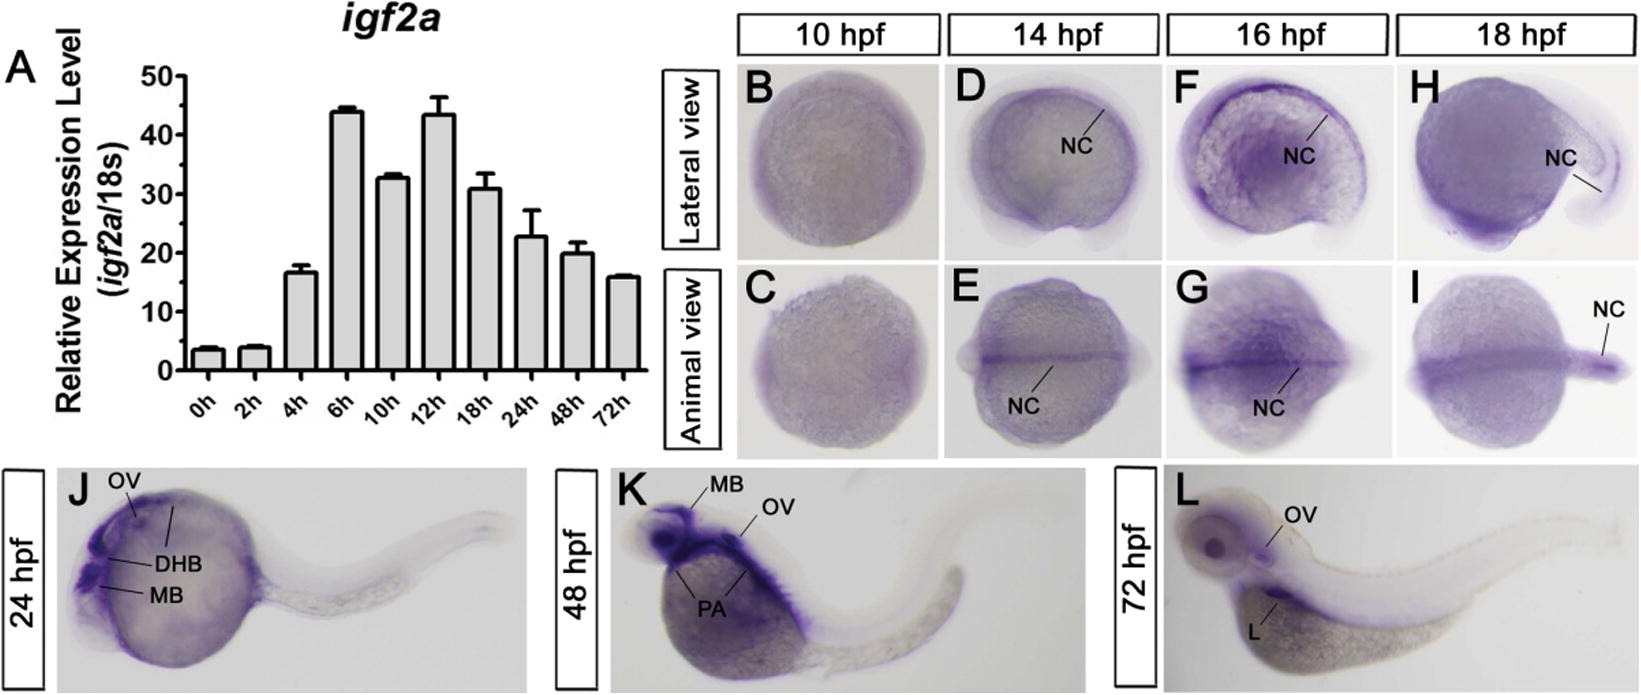
The expression of igf2a during early development of zebrafish. (A) Real-time PCR results showing the temporal expression of igf2a relative to a housekeeping gene (18s) in zebrafish embryos during the first 72 hpf; (B–L) Results of whole mount in situ hybridization showing the spatial expression of igf2a during embryogenesis. (B and C) 10 hpf (bud stage), lateral and animal view; (D and E) 14 hpf (10-somite stage), lateral and animal view; (F and G) 16 hpf (14-somite stage), lateral and animal view; (H and I) 18 hpf (18-somite stage), lateral and animal view; (J) 24 hpf (prim-5 stage), lateral view; (K) 48 hpf (long-pec stage), lateral view; (L) 72 hpf (protruding-mouth stage). MB, midbrain; PA, pharyngeal arch region; OV, otic vesicle; L, liver; DHB, dorsal hindbrain; NC, notochord.
Reprinted from Gene expression patterns : GEP, 15(2), Li, J., Wu, P., Liu, Y., Wang, D., Cheng, C.H., Temporal and Spatial Expression of the four Igf Ligands and two Igf Type 1 Receptors in Zebrafish during Early Embryonic Development, 104-11, Copyright (2014) with permission from Elsevier. Full text @ Gene Expr. Patterns