
Fig. 7, S1
- ID
- ZDB-IMAGE-150430-52
- Publication
- Lush et al., 2014 - ErbB expressing Schwann cells control lateral line progenitor cells via non-cell-autonomous regulation of Wnt/beta-catenin
- All Figures
- Figures for Lush et al., 2014
|
Fig. 7, S1
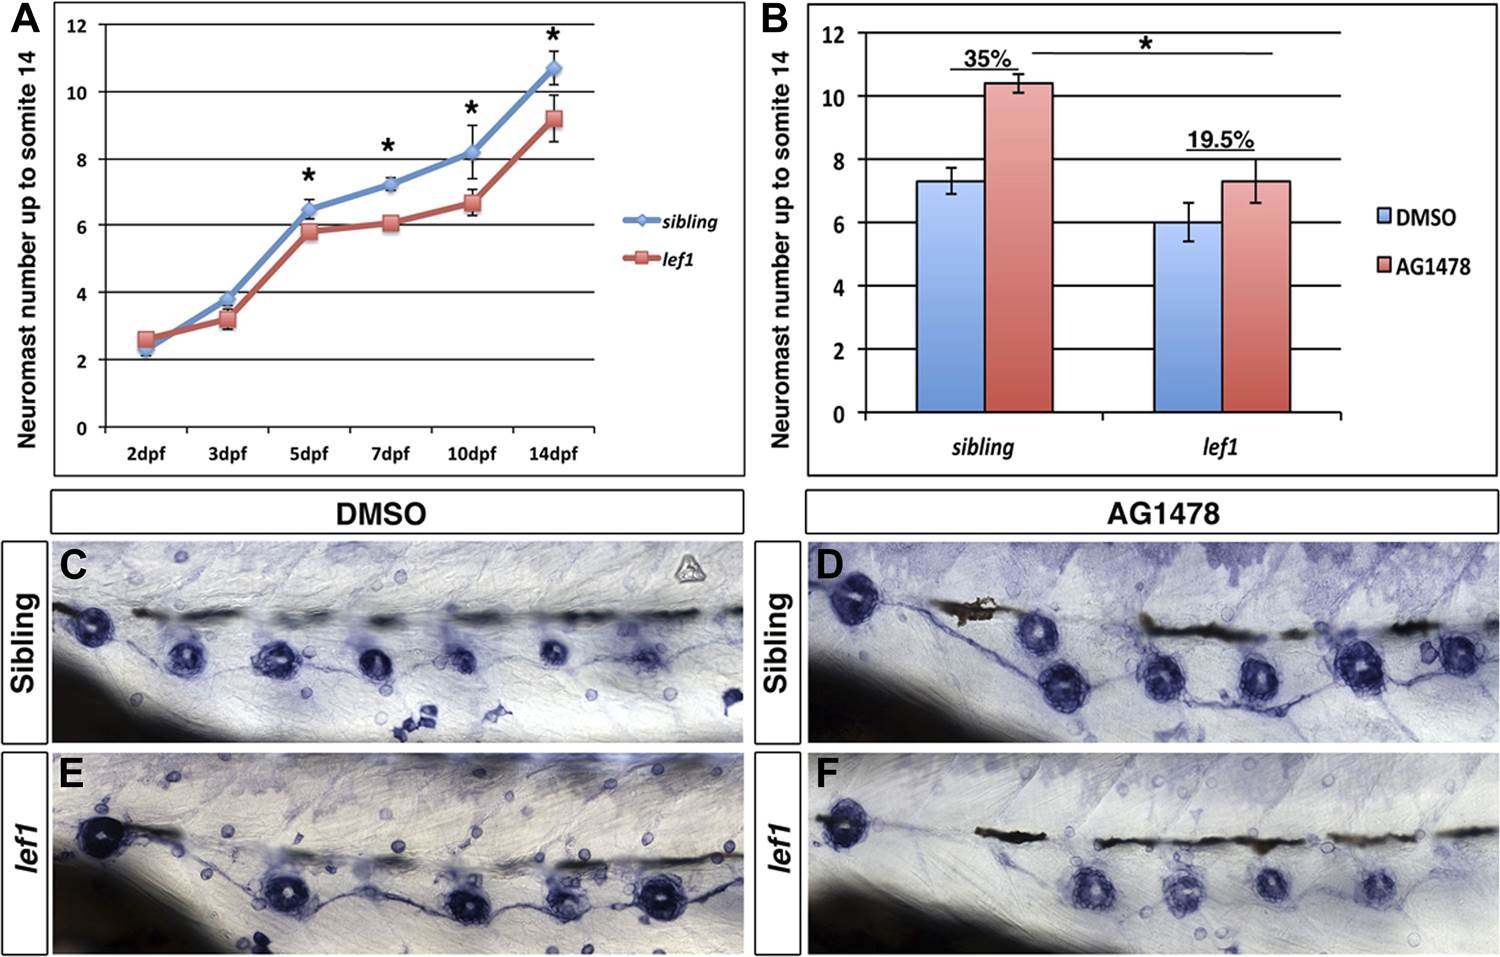
lef1 mutants have decreased intercalary neuromast formation in the absence of ErbB signaling.
Control siblings or lef1 mutants were fixed at 2, 3, 5, 7, 10 and 14 dpf and processed for alkaline phosphatase staining. Because lef1 mutants have a decrease in neuromast deposition, we counted neuromasts just up to somite 14. At 2 and 3 dpf lef1 mutants have the same number of neuromasts as controls (A). From 5 dpf onward there is a significant decrease in neuromast formation in lef1 (A, Student′s t-test, pd0.001). Challenging lef1 mutants with AG1478 at 48 hpf shows only a 19.5% increase in neuromast formation compared to DMSO treatment by 5 dpf, vs 35% increase seen in AG1478 treated control siblings (B, Student′s t-test, p=1.7 E8). Representative images of alkaline phosphatase stained DMSO treated sibling (C) or lef1 mutant (E) or AG1478 treated sibling (D) or lef1 (F).