
Fig. 10
- ID
- ZDB-IMAGE-150430-39
- Genes
- Publication
- Lush et al., 2014 - ErbB expressing Schwann cells control lateral line progenitor cells via non-cell-autonomous regulation of Wnt/beta-catenin
- All Figures
- Figures for Lush et al., 2014
|
Fig. 10
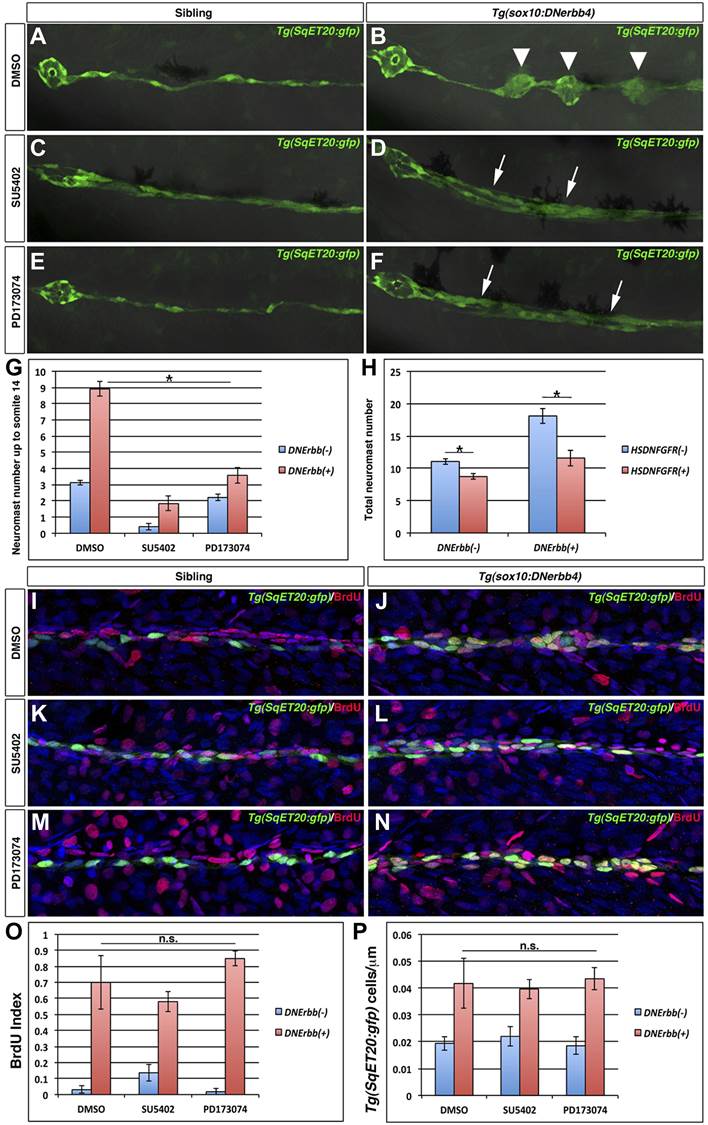
Fgf signaling is required for neuromast formation but not interneuromast proliferation in the absence of ErbB signaling.
Control Tg(SqET20:gfp) or Tg(sox10:DNerbb4)/Tg(SqET20:gfp) larvae were treated for 24 hr starting at 32 hpf with DMSO, SU5402 or PD173074 then allowed to develop until 3 dpf and imaged (A–F). The first primary neuromast is to the left in all images. Control siblings (A) show no intercalary neuromasts, while Tg(sox10:DNerbb4) have several (B, arrowhead). Tg(sox10:DNerbb4) treated with SU5402 (D) or PD173074 (F) show clumps of interneuromast cells (arrows) compared to sibling SU5402 (C) or PD173074 (E) treated but no intercalary neuromasts. (G) Quantification of neuromast number up to somite 14 shows a decrease when control siblings are treated with SU5402 or PD173074 (blue bars, One-way ANOVA with Tukey pairwise comparison, pd0.05). (G) Extra neuromast formation is inhibited when Tg(sox10:DNerbb4) fish are treated with SU5402 or PD173074 (red bars, one-way ANOVA with Tukey pairwise comparison, pd0.05). (H) Tg(sox10:DNerbb4) were crossed to Tg(hsp70l:dnfgfr1-EGFP) and larvae were heat shocked at 32 hpf then allowed to grow to 3 dpf. DNFgfr1 reduces neuromasts slightly in control siblings (blue bars, Student’s t-test, p=7.1 E9) and completely blocks extra neuromast formation in Tg(sox10:DNerbb4) (red bars, Student’s t-test, p=1.5 E7). To measure proliferation, control Tg(SqET20:gfp) or Tg(sox10:DNerbb4)/Tg(SqET20:gfp) larvae were treated with BrdU plus DMSO, SU5402 or PD173074 at 32 hpf then fixed at 48 hpf. Fish were then processed for BrdU and GFP immunohistochemistry (I–N). All Tg(sox10:DNerbb4)/Tg(SqET20:gfp) treated fish (J, L and N) show higher BrdU incorporation when compared to control Tg(SqET20:gfp) siblings (I, K and M). (O) Quantification of BrdU index shows no significant difference between DMSO, SU5402 or PD173074 treated Tg(sox10:DNerbb4) larvae (red bars, one-way ANOVA with Tukey pairwise comparison, pe0.1). (P) Quantification of Tg(SqET20:gfp) cell number shows no difference in Tg(sox10:DNerbb4) larvae treated with DMSO, SU5402 or PD173074 (red bars, one-way ANOVA with Tukey pairwise comparison, pe0.9).