
Fig. 4
- ID
- ZDB-IMAGE-150421-4
- Genes
- Publication
- Navis et al., 2015 - Loss of cftr function leads to pancreatic destruction in larval zebrafish
- All Figures
- Figures for Navis et al., 2015
|
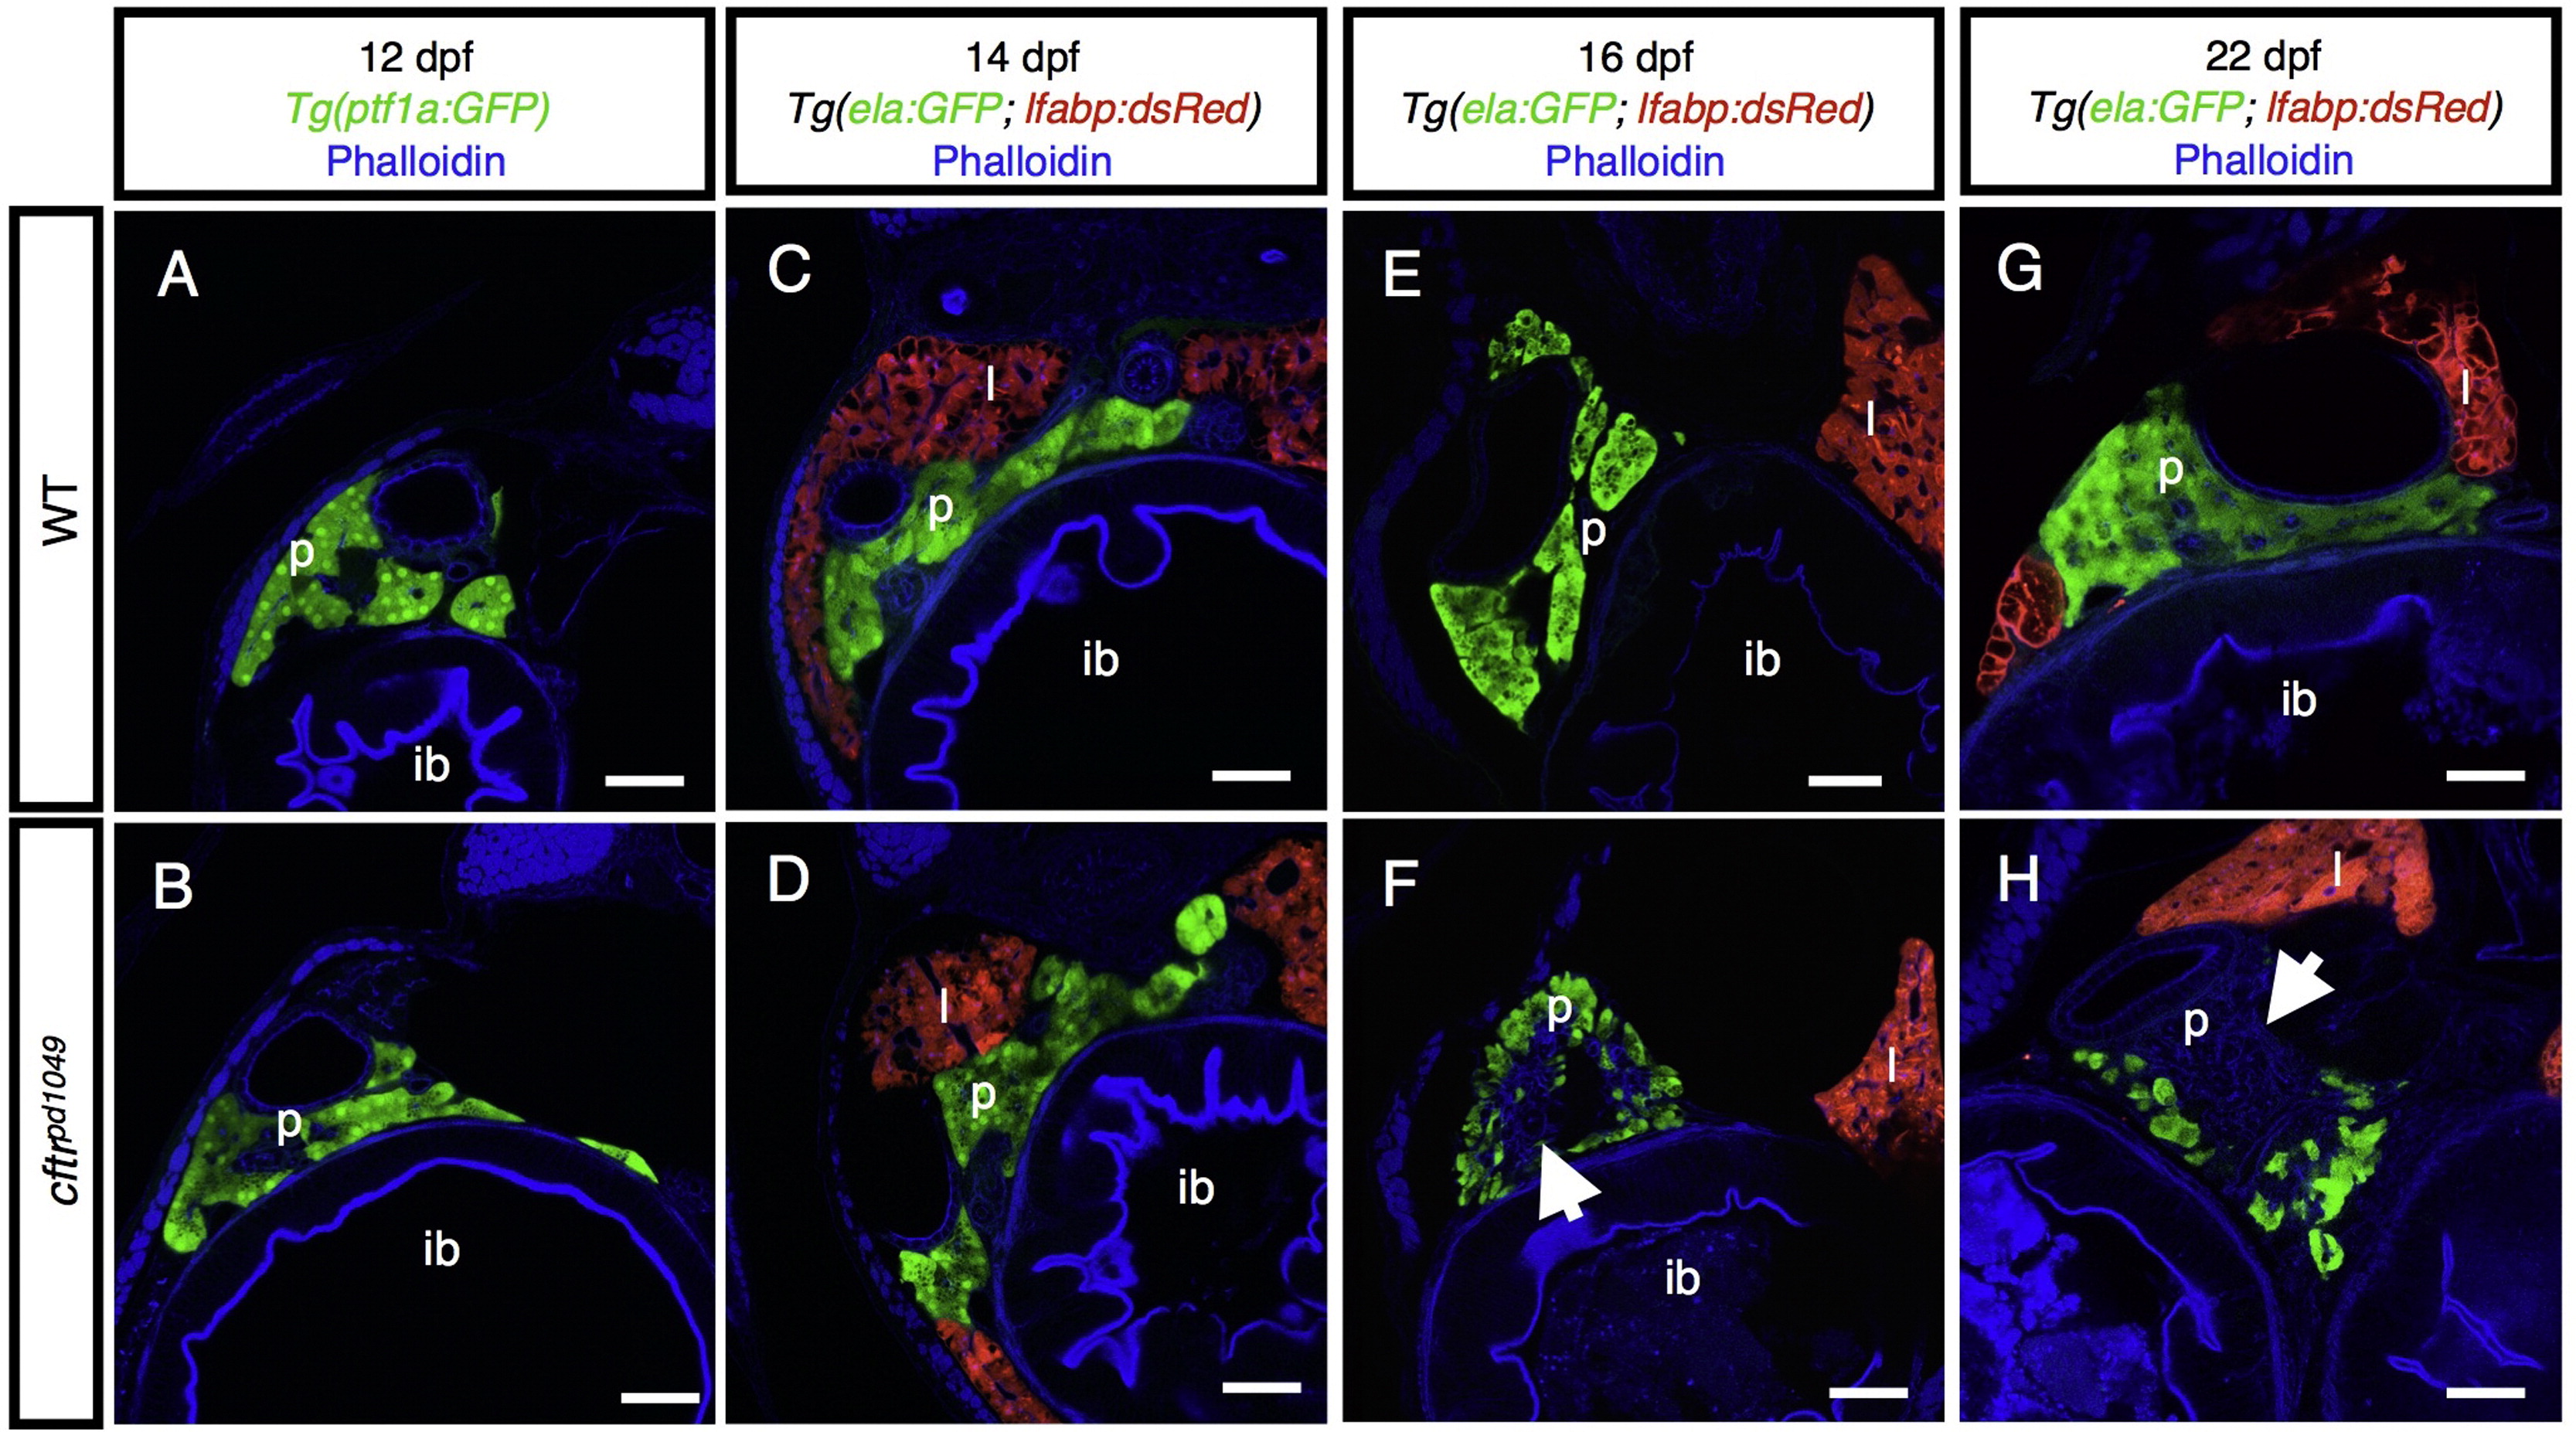
Fig. 4
Timecourse of pancreatic destruction incftr mutants. (A and B) Transverse section of Tg(ptf1a:GFP) expression marking the acinar cells in (A) WT and (B) cftr mutant samples. (C and D) Transverse section at 14 dpf of (C) WT and (D) cftr mutant pancreas marked by ela:GFP expression. (E and F) Transverse section of (E) WT and (F) cftr mutant samples expressing ela:GFP in the acini demonstrating loss of pancreatic acinar tissue at 16 dpf. (G and H) Transverse section of (G) WT and (H) cftr mutant samples expressing ela:GFP in the pancreas at 22 dpf with severe pancreatic destruction. Arrow indicates absent acinar tissue. Scale bars=50 µm.
Reprinted from Developmental Biology, 399(2), Navis, A., Bagnat, M., Loss of cftr function leads to pancreatic destruction in larval zebrafish, 237-48, Copyright (2015) with permission from Elsevier. Full text @ Dev. Biol.