
Fig. 7
- ID
- ZDB-IMAGE-150331-24
- Genes
- Publication
- Shao et al., 2009 - Down syndrome critical region protein 5 regulates membrane localization of Wnt receptors, Dishevelled stability and convergent extension in vertebrate embryos
- All Figures
- Figures for Shao et al., 2009
|
Fig. 7
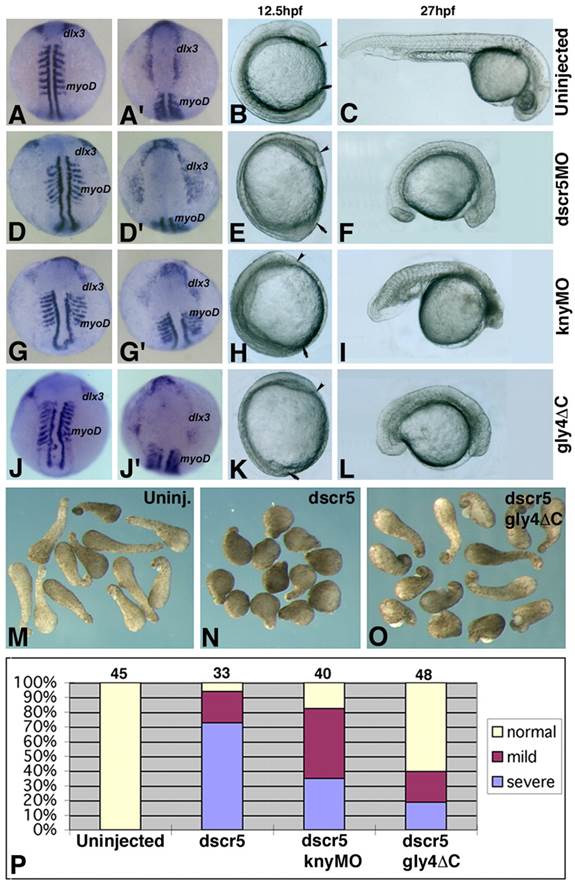
Functional interaction between Dscr5 and Knypek/Glypican 4. (A-L) Comparison of CE defects in control embryos (A-C) and following injection of dscr5MO (D-F), knyMO (G-I) and gly4ΔC RNA (J-L), as indicated on the right. (A,A′,D,D′,G,G′,J,J′) Embryos at the eight-somite stage were simultaneously hybridized with myoD and dlx3 probes. Dorsal view (A,D,G,J) shows the expression of myoD, and dorsoanterior view (A′,D′,G′,J′) shows the expression of dlx3. (B,E,H,K) Live images at 12.5 hpf with anterior to the top and dorsal side to the left. Arrowheads and arrows denote the anterior tip of the hypoblast and the tail region, respectively. (C,F,I,L) Live images at 27 hpf with anterior to the right. (M-O) Rescue by gly4ΔC of CE movements in Xenopus animal cap explants overexpressing dscr5. Uninjected (M), dscr5RNA-injected (N), and dscr5RNA- and gly4ΔC-coinjected (O) embryos. (P) Rescue by knypek knockdown or gly4ΔC overexpression of CE movements in zebrafish whole embryos overexpressing dscr5. The phenotypes were scored at 25 hpf from three independent experiments, with total numbers indicated at the top.