
IMAGE
Fig. 1
- ID
- ZDB-IMAGE-150325-14
- Genes
- Publication
- Mommaerts et al., 2014 - Smoc2 modulates embryonic myelopoiesis during zebrafish development
- All Figures
- Figures for Mommaerts et al., 2014
Image
|
Figure Caption
Fig. 1
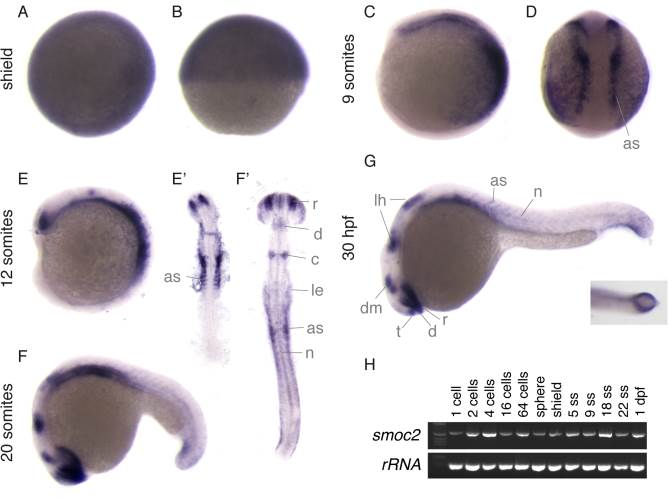
Expression analysis of smoc2. A–G: Expression pattern of smoc2 during the indicated stages of zebrafish development. From somitogenesis onward, transcripts were detected in anterior somites (as), anterior and ventral retina (r), dorsal diencephalon (d), telencephalon (t), dorsal midbrain (dm), lateral hindbrain (lh), cerebellum (c), lateral epidermis (le) and the notochord (n). H: RT-PCR analysis at indicated stages of development show smoc2 transcripts from early stages onward.
Figure Data
Acknowledgments
This image is the copyrighted work of the attributed author or publisher, and
ZFIN has permission only to display this image to its users.
Additional permissions should be obtained from the applicable author or publisher of the image.
Full text @ Dev. Dyn.