
Image
|
Figure Caption
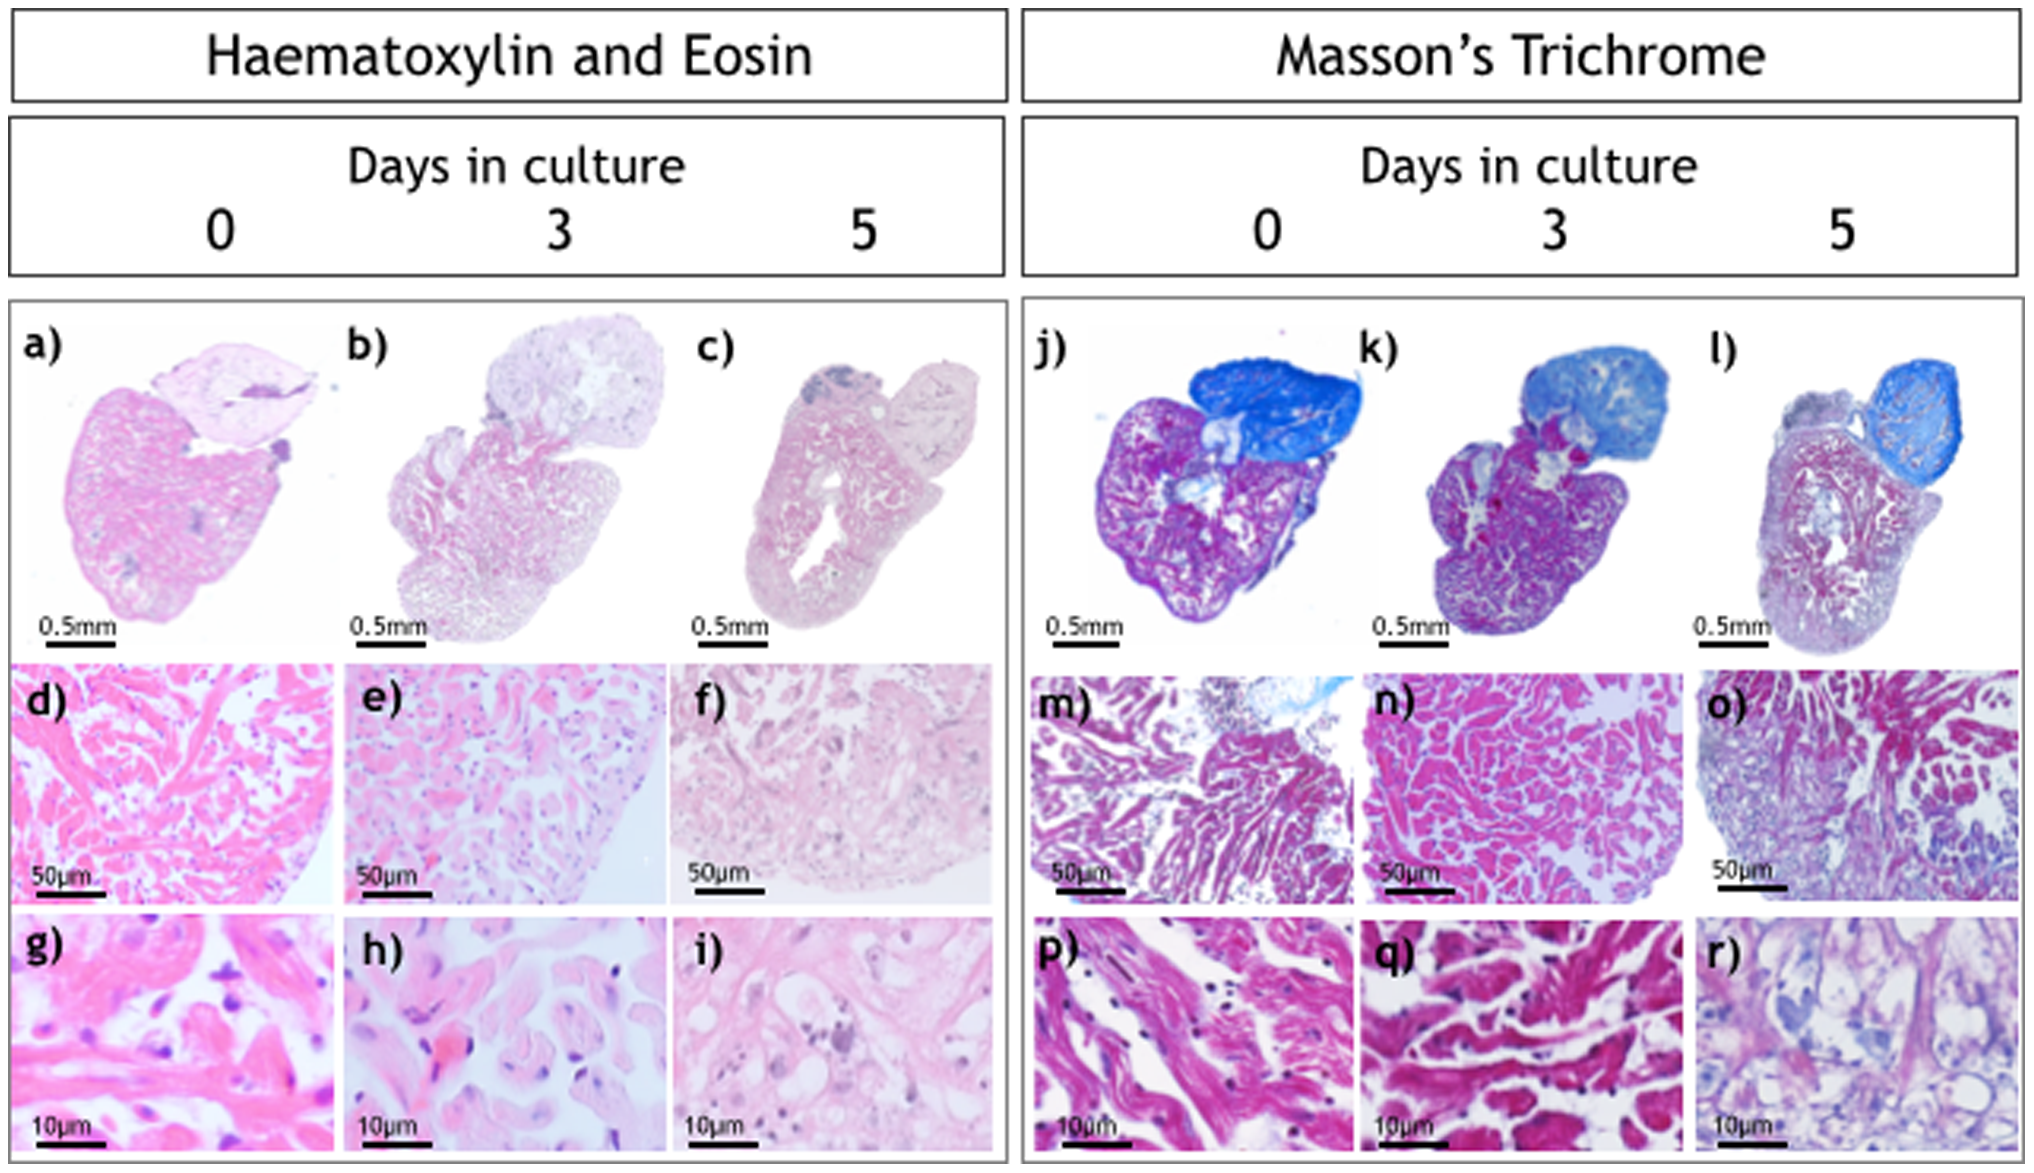
Fig. 4
Histological analysis of isolated hearts.
Haematoxylin and Eosin (H&E; a–i) and Masson’s trichrome staining (j–r) of hearts at 0, 3 and 5 days in culture. Higher magnification images (g, h, i) show normal cellular architecture at day 0 and day 3 with significant changes at day 5.
Acknowledgments
This image is the copyrighted work of the attributed author or publisher, and
ZFIN has permission only to display this image to its users.
Additional permissions should be obtained from the applicable author or publisher of the image.
Full text @ PLoS One