
|
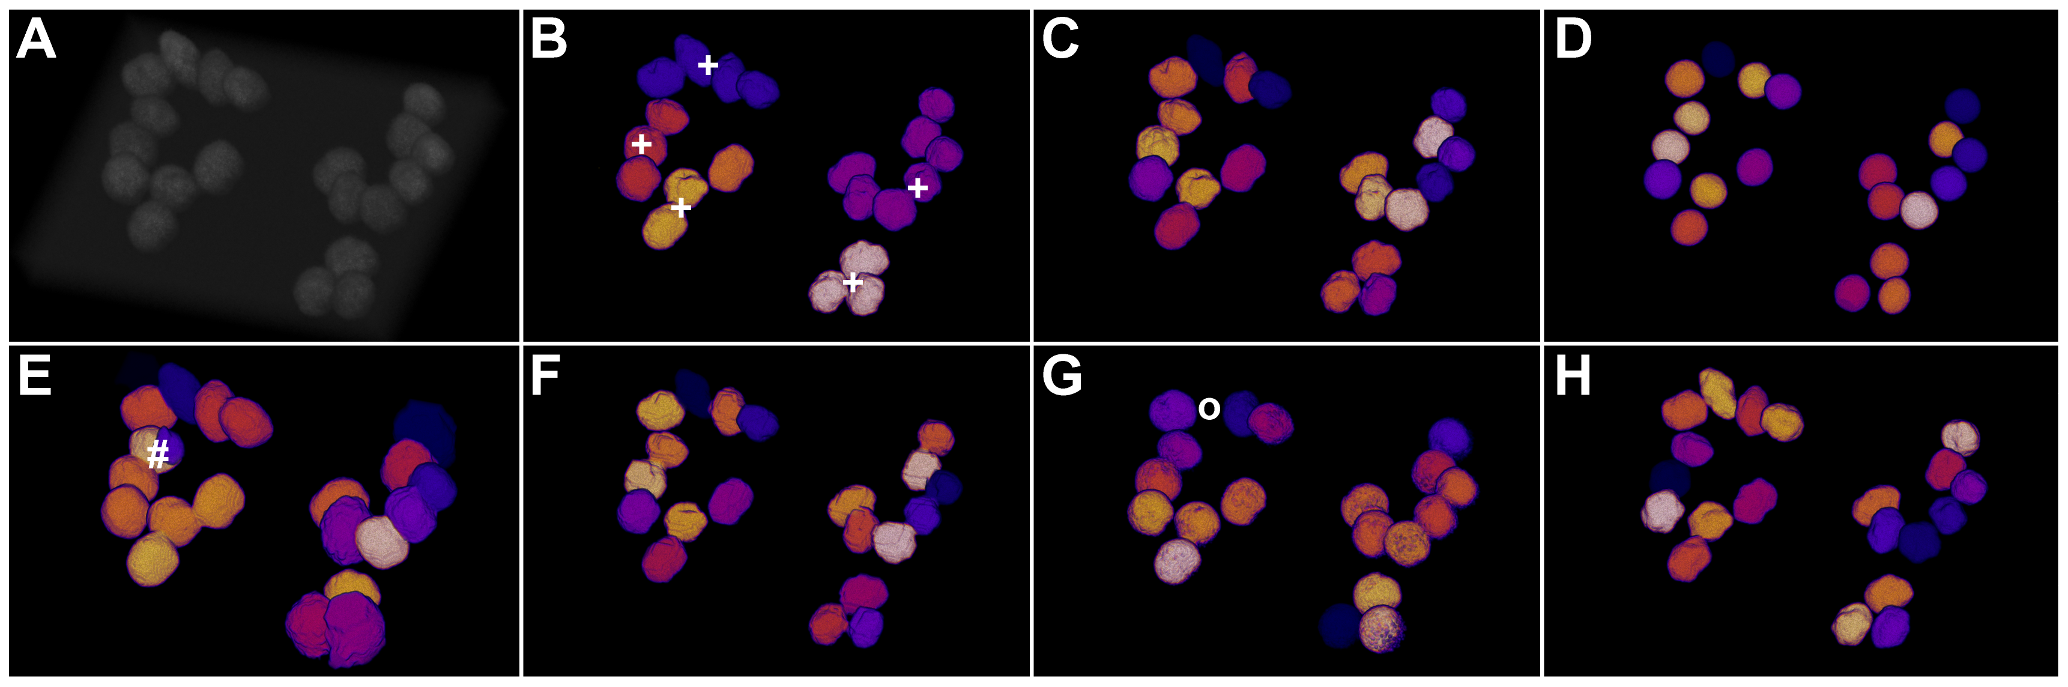
Fig. 5
Comparison of the segmentation quality achieved by the investigated algorithms on simulated 3D benchmark images by Svoboda et al. (HL60 cell line, low SNR, 75% clustering probability)[35].
Simulated original image (A), adaptive thresholding using Otsu’s method [23] (B), Otsu’s method combined with watershed-based blob splitting [23], [30] (C), geodesic active contours [31] (D), gradient vector flow tracking [16] (E), graph-cuts segmentation [17] (F), TWANG segmentation (G) and the simulated ground truth image (H). The symbols indicate segmentation errors for nuclei that are either split (#), merged (+), missing (o) or spurious (~).