
Image
|
Figure Caption
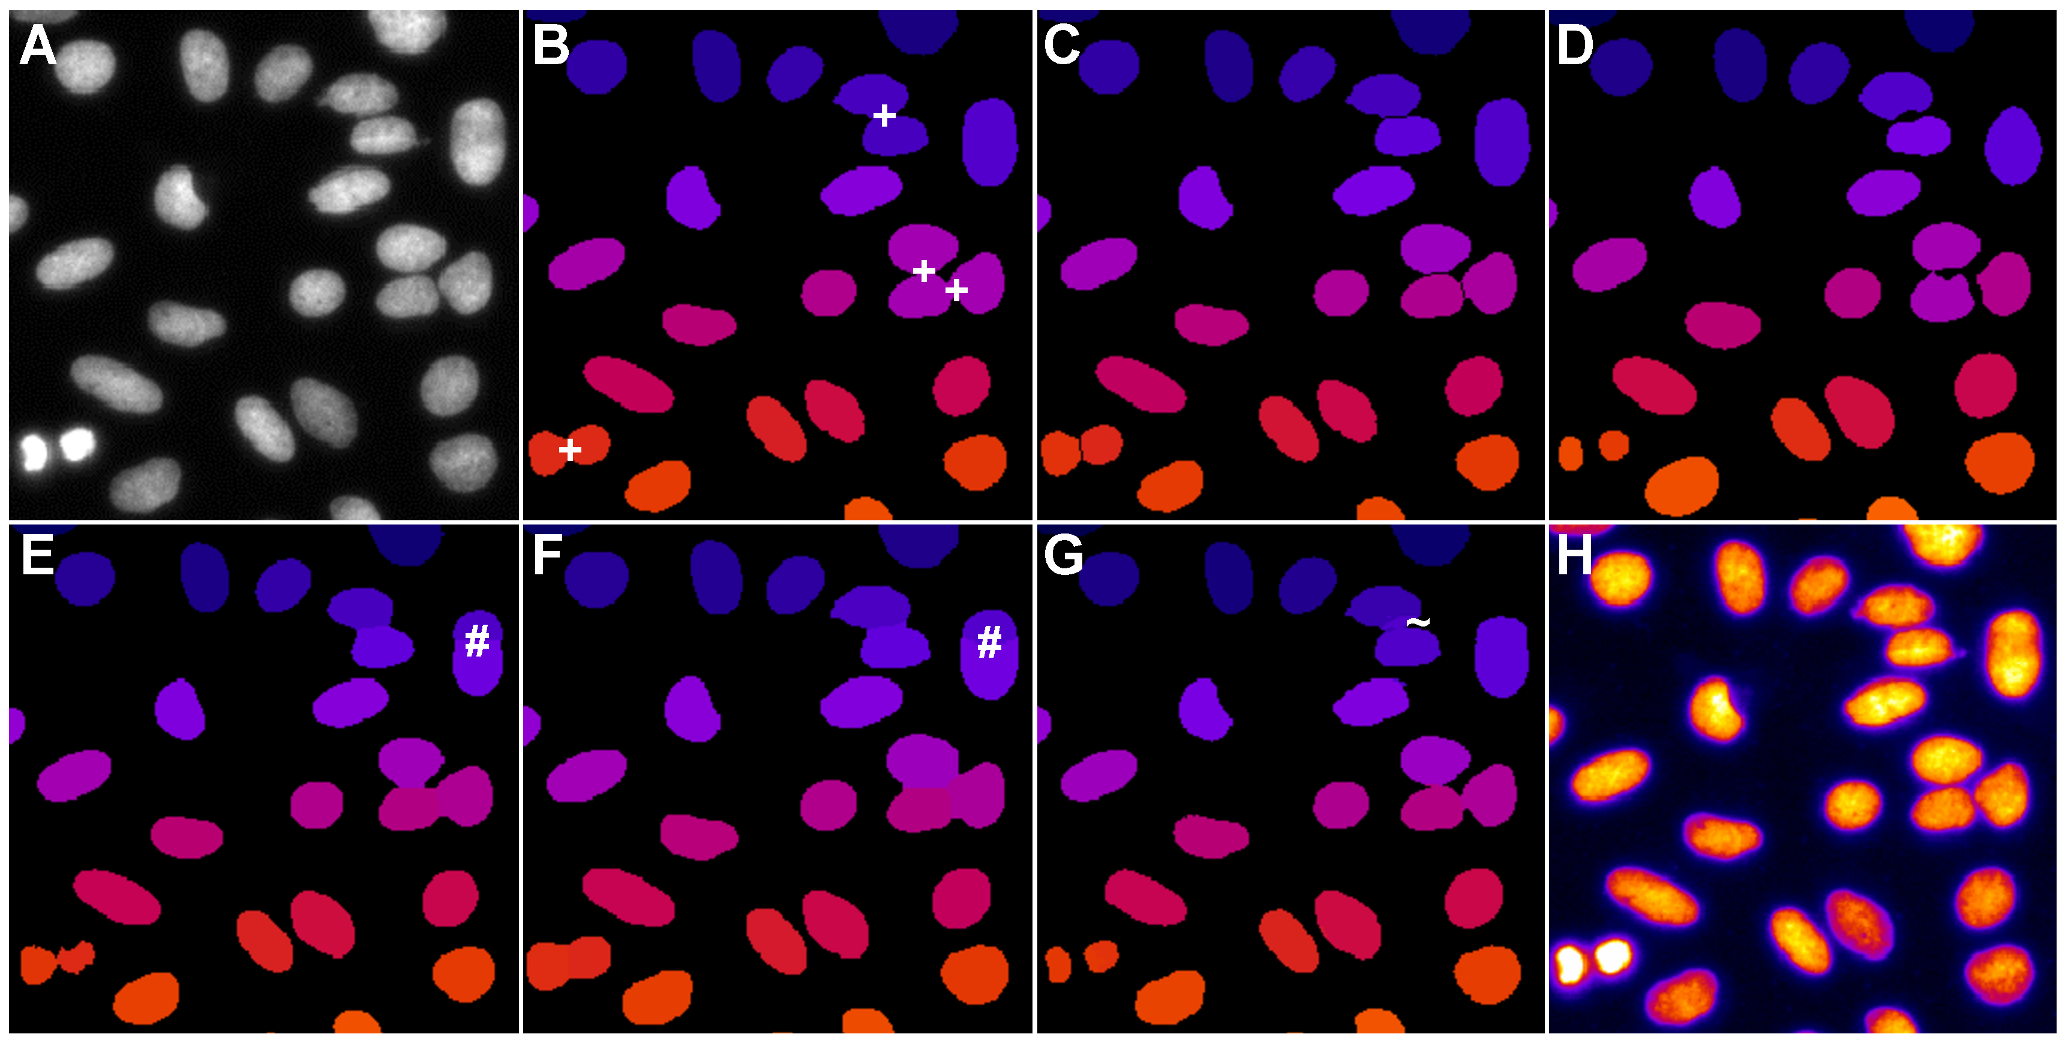
Fig. 4
Comparison of the segmentation quality achieved by the investigated algorithms on 2D benchmark images from the Broad Bioimage Benchmark Collection (BBBC006v1).
Original image (A), adaptive thresholding using Otsu’s method [23] (B), Otsu’s method combined with watershed-based blob splitting [23], [30] (C), geodesic active contours [31] (D), gradient vector flow tracking [16] (E), graph-cuts segmentation [17] (F), TWANG segmentation (G) and a false colored original image (H). The symbols indicate segmentation errors for nuclei that are either split (#), merged (+), missing (o) or spurious (~).
Acknowledgments
This image is the copyrighted work of the attributed author or publisher, and
ZFIN has permission only to display this image to its users.
Additional permissions should be obtained from the applicable author or publisher of the image.
Full text @ PLoS One