
IMAGE
Fig. 4
- ID
- ZDB-IMAGE-140808-18
- Genes
- Publication
- Qiao et al., 2014 - Snail modulates the assembly of fibronectin via alpha5 integrin for myocardial migration in zebrafish embryos
- All Figures
- Figures for Qiao et al., 2014
Image
|
Figure Caption
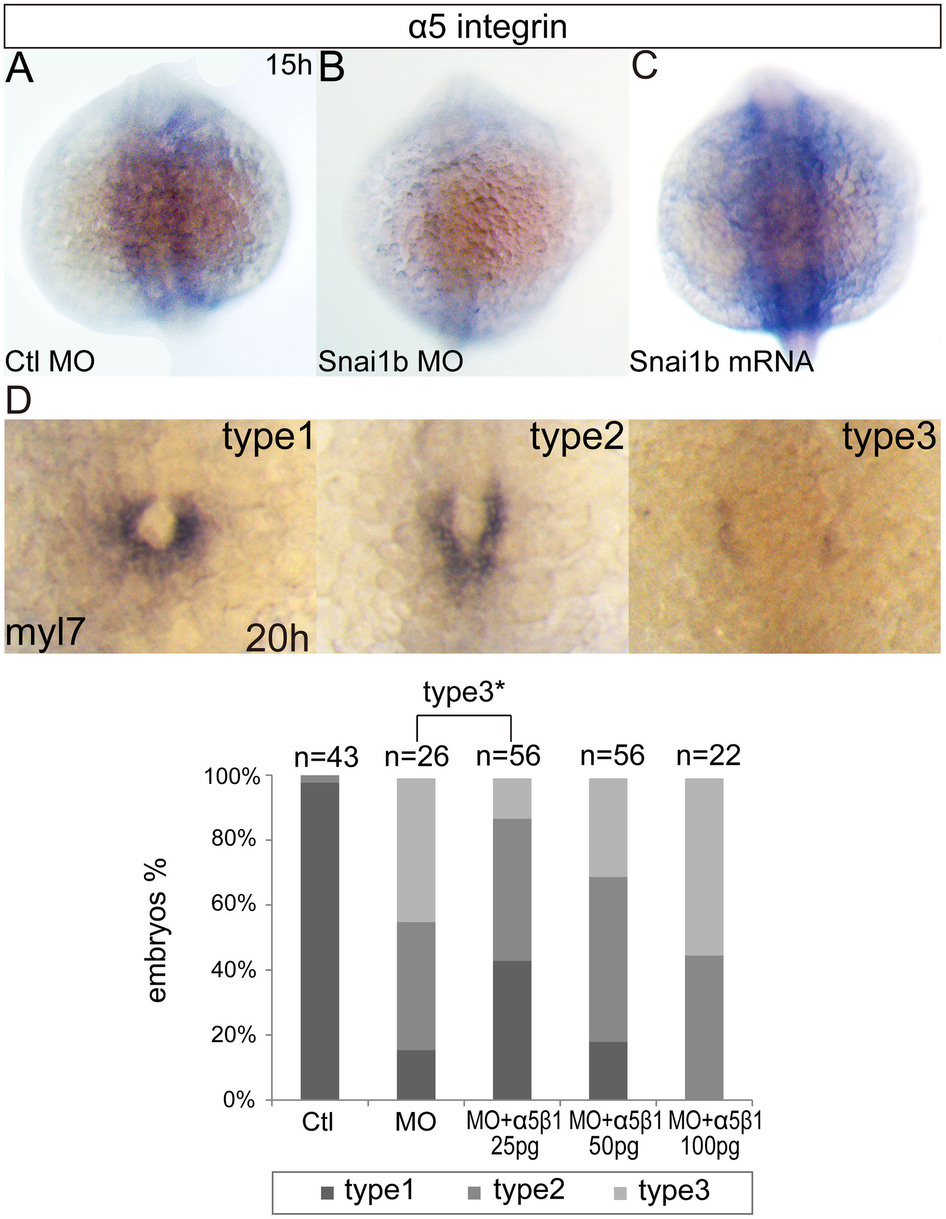
Fig. 4 In situ hybridization for indicated genes. (A–C): Expression pattern of α5 integrin in different embryos at 15hpf, dorsal view. (D): different types of phenotypes displayed in injected embryos at 20hpf. Graph shows phenotypic ratios of injected embryos at the same stage. Percentage of embryos of type 3 between embryos with snai1b MO and those with both snai1b MO and 25pg α5β1 integrin protein was statistically significant (P = 0.023, t-test). Ctl means Ctl MO, MO means snai1b MO.
Figure Data
Acknowledgments
This image is the copyrighted work of the attributed author or publisher, and
ZFIN has permission only to display this image to its users.
Additional permissions should be obtained from the applicable author or publisher of the image.
Full text @ Sci. Rep.