
Fig. 1
- ID
- ZDB-IMAGE-140808-1
- Genes
- Antibodies
- Publication
- Monteiro et al., 2014 - V-ATPase proton pumping activity is required for adult zebrafish appendage regeneration
- All Figures
- Figures for Monteiro et al., 2014
|
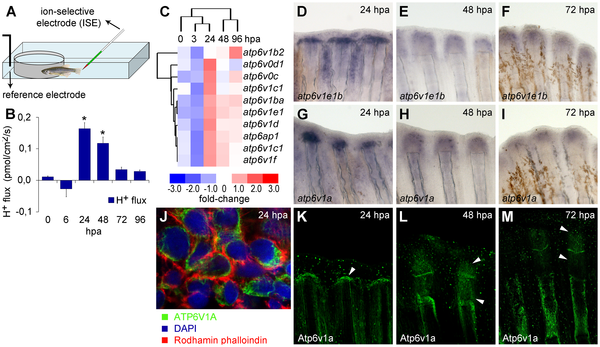
Fig. 1 (A) Recording chamber for H+ flux measurement using SIET, representing zebrafish emerged in recording medium. (B) H+ efflux established during regeneration. *statistical significant results (n = 10, p<0.05). (C) Affimetrix microarray to assess gene expression during caudal fin regeneration, compared to intact fins. (D–I) In situ hybridization of V-ATPase subunits atp6v1e1b (D–F) and atp6v1a (G–I), at 24 hpa (D, G), 48 hpa (E–H) and 72 hpa (F–I). (J–M) Immunohistochemical detection of Atp6v1a at 24 hpa (J, K), 48 hpa (L) and 72 hpa (M). White arrowheads point to the Atp6v1a blastema localization. (J) Detail of Atp6v1a (green) cellular localization in blastema cells, 24 hpa. hpa: hours post amputation. For each panel, n = 6, except mentioned otherwise.