
|
Fig. 3
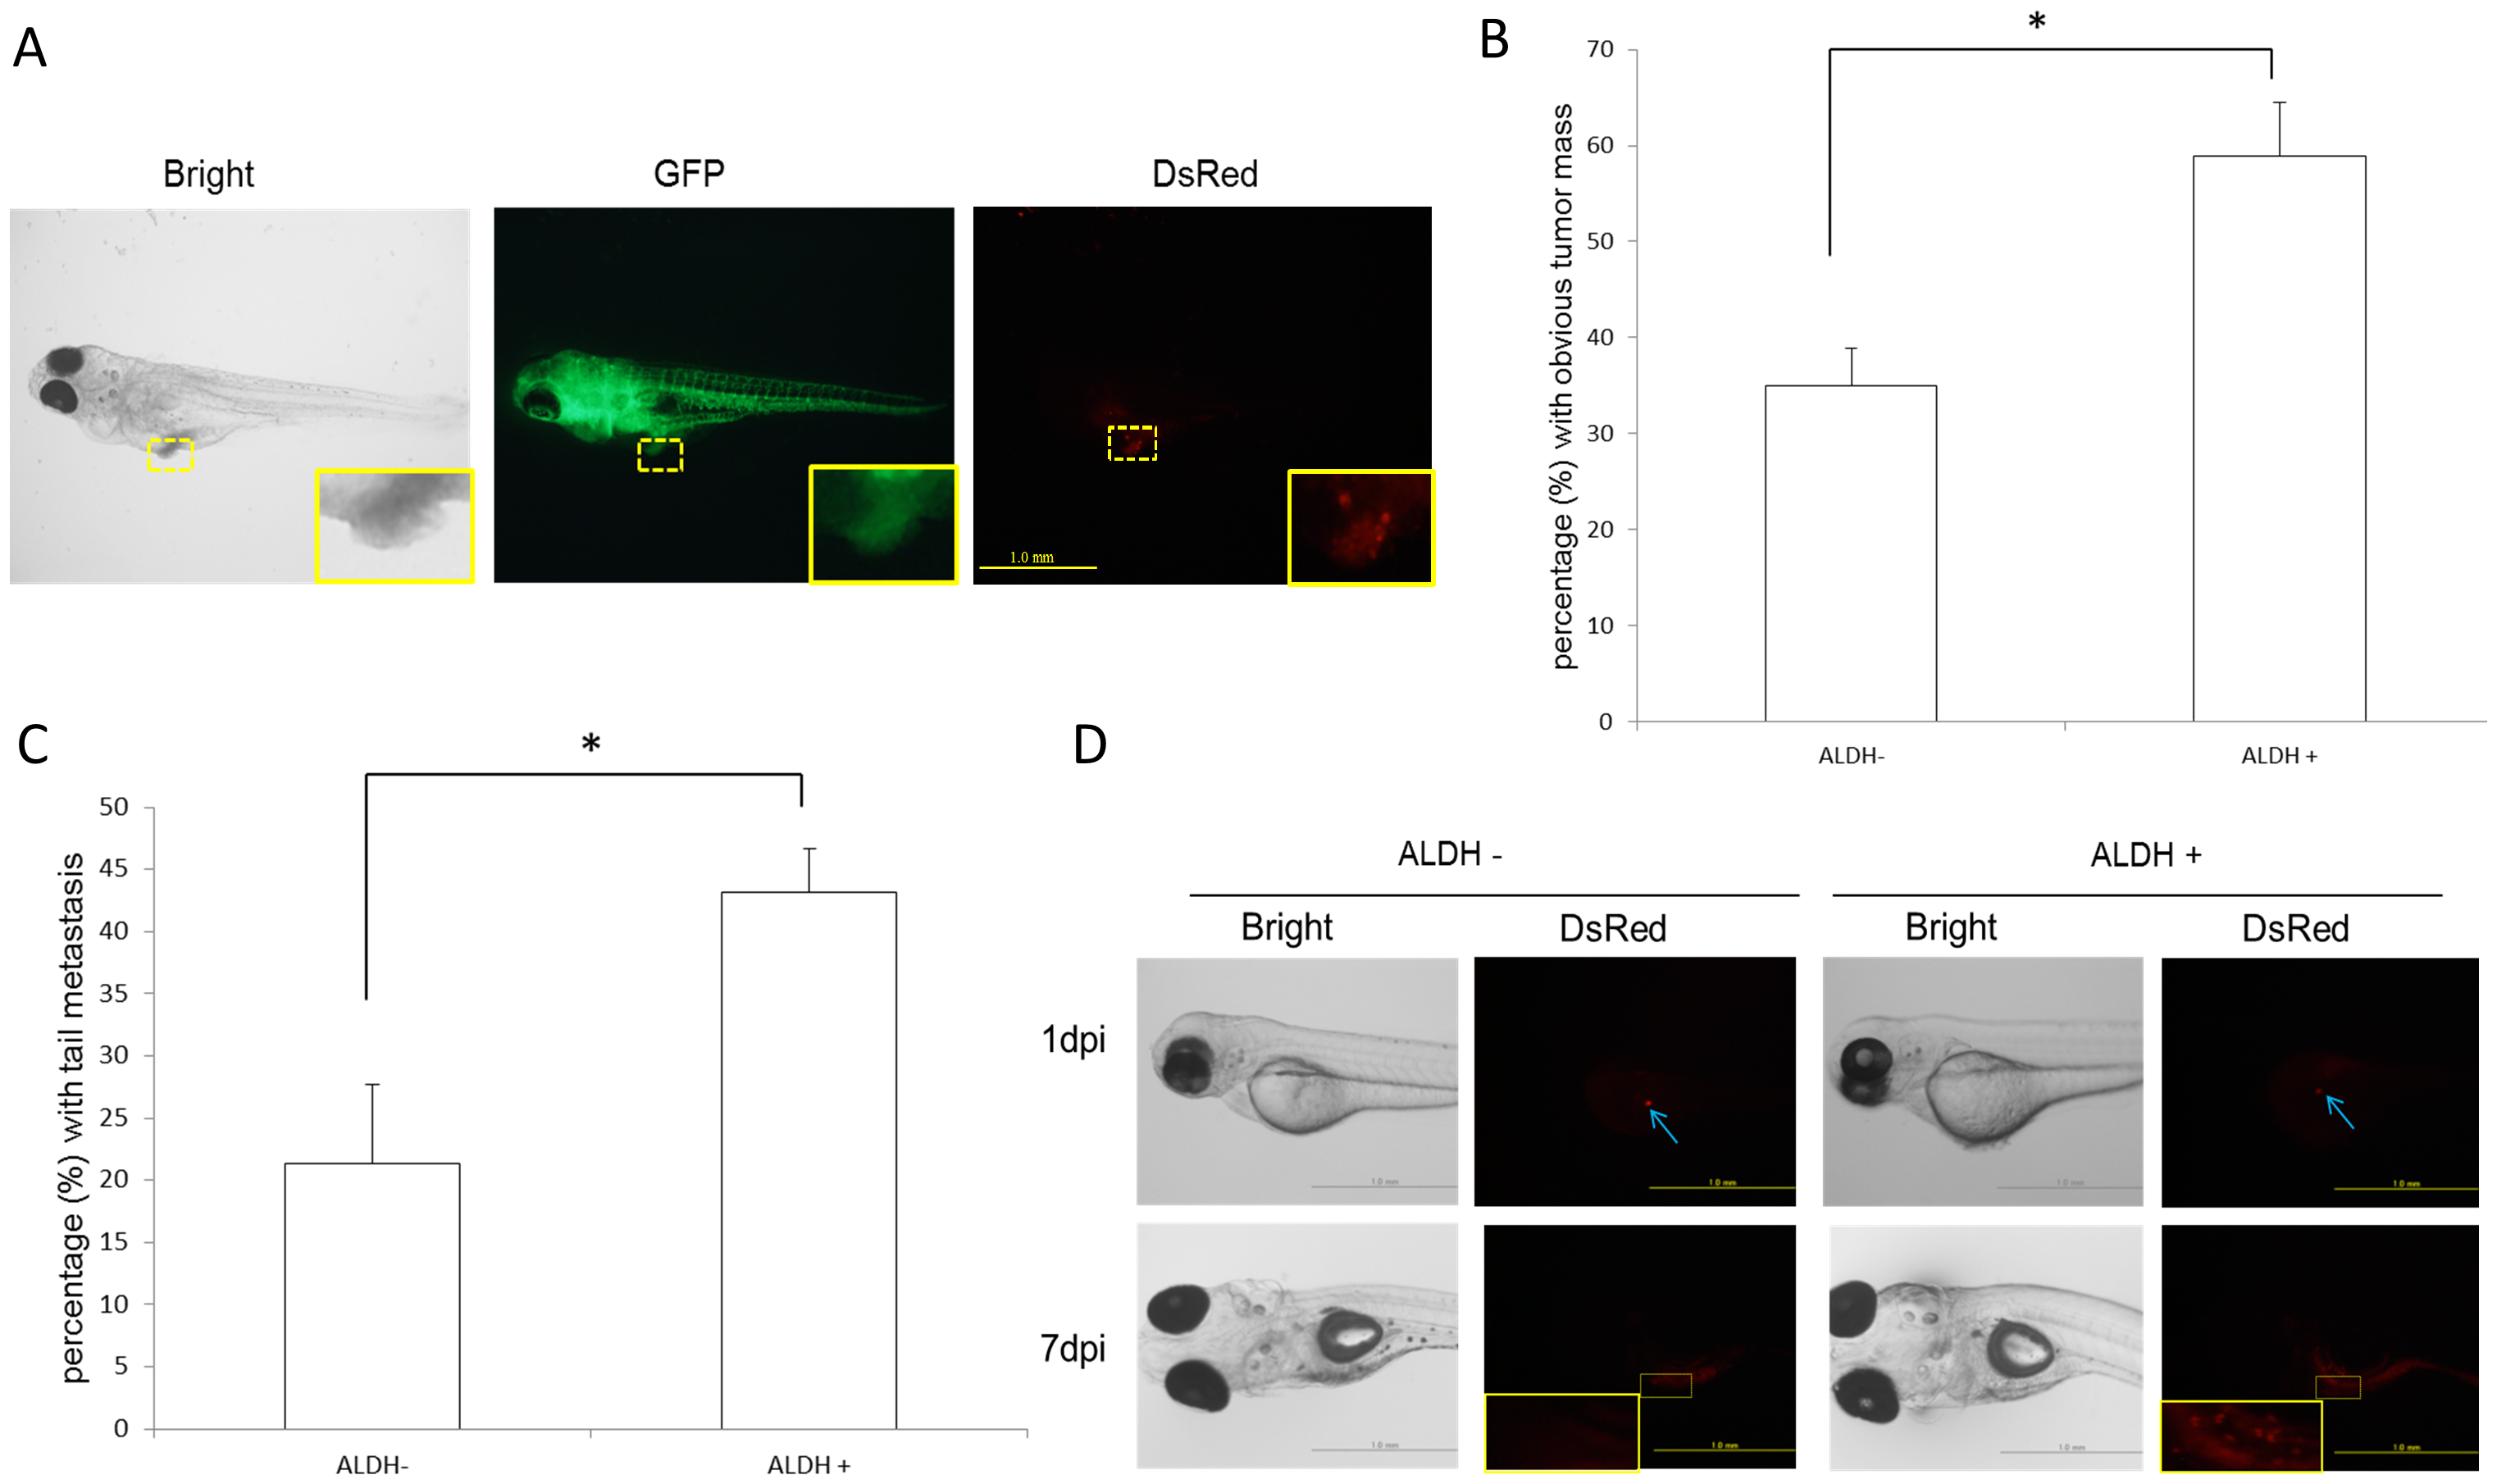
LSC ability in zebrafish xenograft.
(A) Typical images of cancer xenografts at 6 days post-injection (dpi). Scale bar: 1.0 mm. The implanted tumor is framed in yellow (the magnification shows the outlined area). (B) In 6-dpi xenografts, ALDH+ cells exhibited greater tumorigenicity than ALDH- cells. P<0.05, based on 3 independent experiments. (C) The distal (tail region) migration of ALDH+ cells was greater than that of ALDH- cells. P<0.05, based on 3 independent experiments. (D) In single cell xenotransplants, ALDH+ cells proliferated at 7 dpi whereas ALDH- cells were no longer detectable. Scale bar: 1.0 mm. The implanted tumor is framed in yellow (the magnification shows the outlined area).