
|
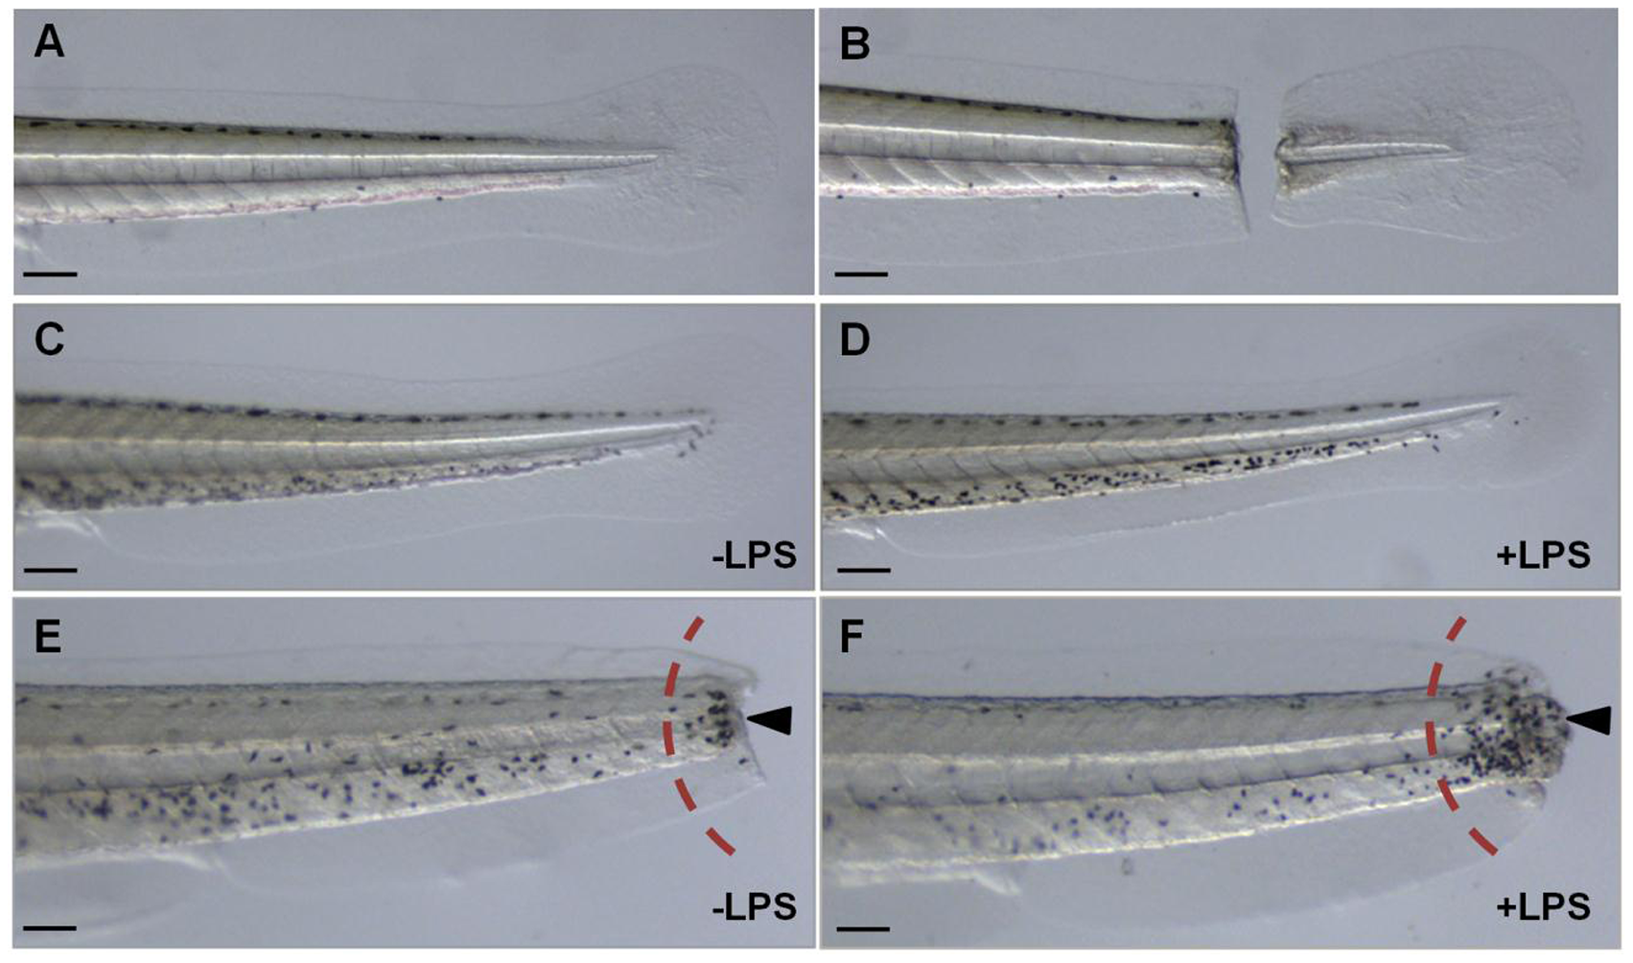
Fig. 1
LPS-enhanced leukocyte migration assay in 4 dpf zebrafish larvae.
All larvae (nacre) are four days post-fertilization (4 dpf), with anterior to the left, scale bar = 10 μm. A, tail of alive larva without tail cut; B, tail of alive larva with tail cut; C–D, whole-mount MPO staining in uncut tails of zebrafish larvae; C, without lipopolysaccharides (LPS) and D, with lipopolysaccharides (+LPS); E–F, whole-mount MPO staining in cut tails of zebrafish larvae; E, without the inclusion of LPS; F, with the inclusion of LPS. Dark-spots (marked by arrows) represent the migrating leukocytes, which are semi-quantified in the region to the right of the dashed red arc.