
Fig. 2
- ID
- ZDB-IMAGE-140714-66
- Genes
- Publication
- Nguyen-Chi et al., 2014 - Transient infection of the zebrafish notochord with E. coli induces chronic inflammation
- All Figures
- Figures for Nguyen-Chi et al., 2014
|
Fig. 2
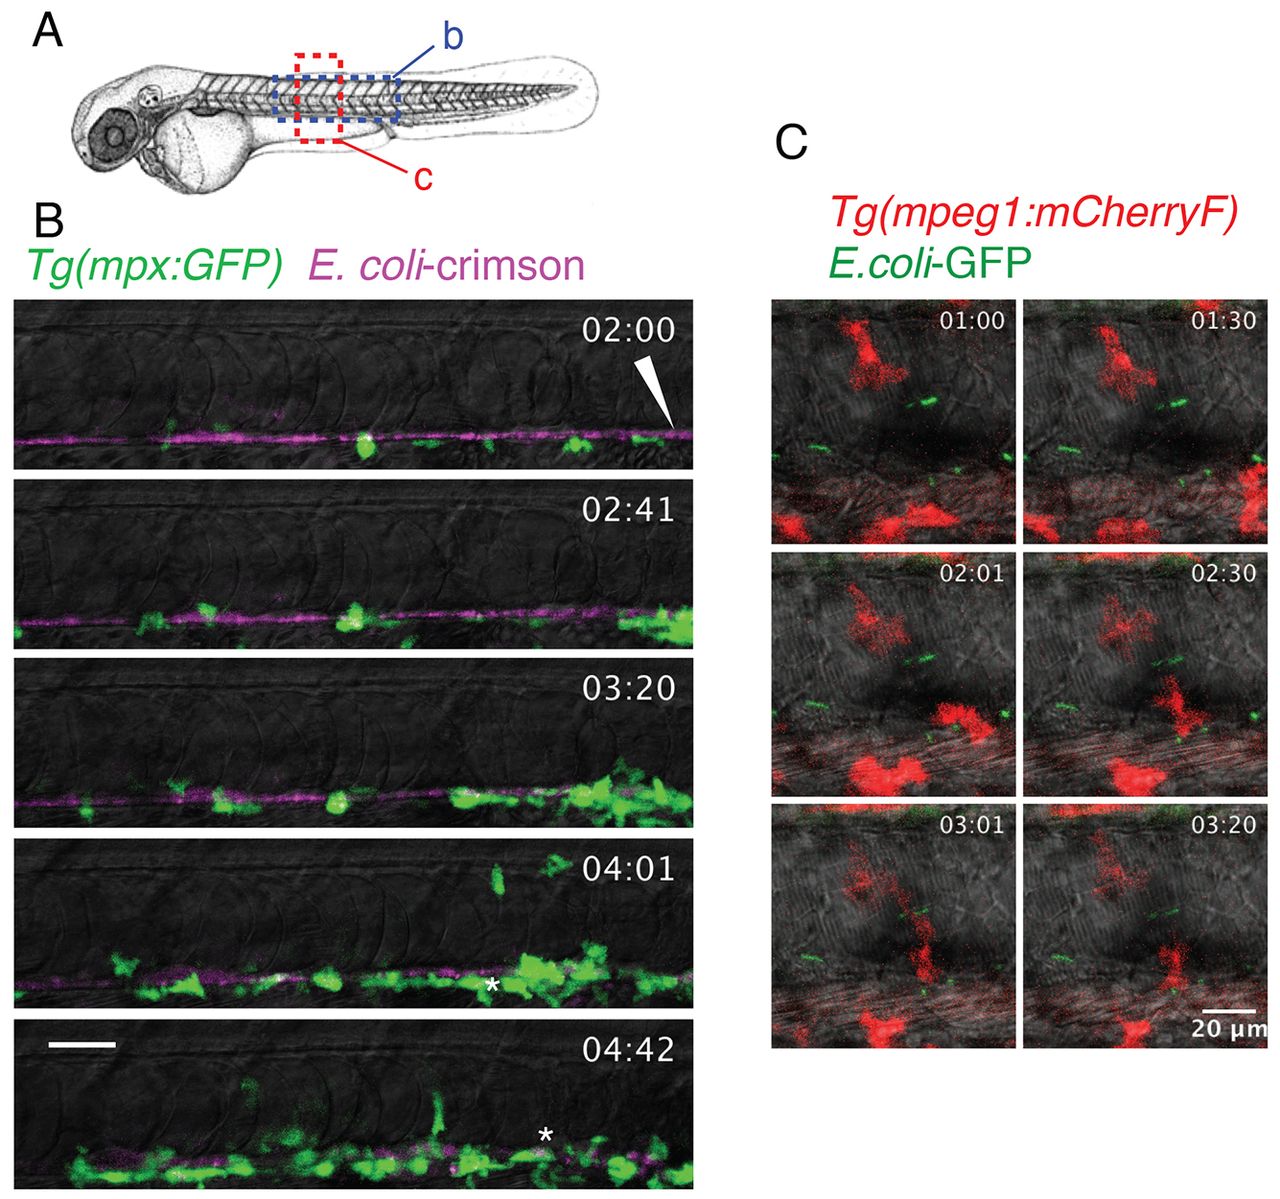
Behaviour of neutrophils and macrophages following notochord infection. (A) Diagram showing the regions of the larvae imaged in B and C (dashed boxes). (B) Tg(mpx:GFP) larvae that had been infected with crimson-expressing E. coli (magenta) in the notochord at 48 hpf. The general behaviour of neutrophils (green) was imaged using four-dimensional confocal microscopy, starting at 2 hpi for a duration of 3 hours (the time post-infection is shown in the top right corner). *Neutrophils loaded with bacteria, the arrowhead indicates the injection site. (C) Tg(mpeg1:mCherryF) larvae that had been infected with GFP-expressing E. coli (green) at 48 hpf in the notochord were imaged in the region represented in A to visualise the behaviour of macrophages (red) using four-dimensional confocal microscopy at 1 hpi for a duration of 3 hours and 20 minutes. Scale bars: 20 μm.