
|
Fig. 4
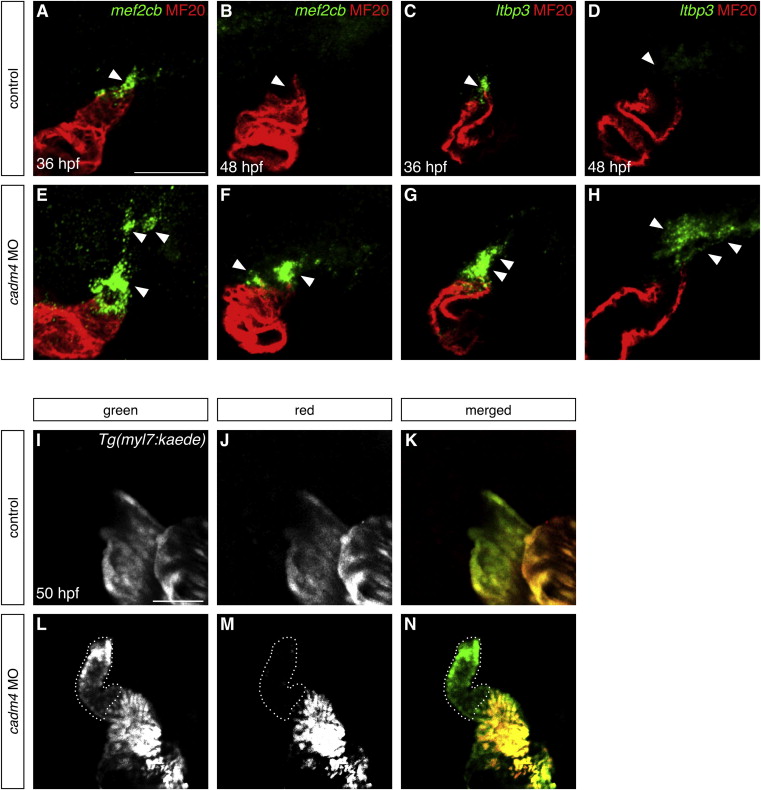
Cadm4 Curtails Addition of Late-Differentiating Cells to the Arterial Pole
(A–H) Expression of mef2cb (A, B, E, and F) and ltbp3 (C, D, G, and H) juxtaposed with staining of differentiated myocardium (as in Figures 1D and 1E) at 36 (A, C, E, and G) and 48 (B, D, F, and H) hpf; partial reconstructions (A, B, E, and F) or single slices (C, D, G, and H) of lateral views.
(A–D) In control embryos, expression of both genes (arrowheads) becomes extinguished as OFT differentiation reaches completion.
(E–H) In contrast, expression of both genes (arrowheads) is expanded and prolonged in cadm4 morphants.
(I–N) Single slices of lateral views of Tg(myl7:kaede)-expressing hearts at 50 hpf, following photoconversion at 37 hpf. Comparison of green fluorescence (I and L) and red fluorescence (J and M) reveals the presence of late-differentiating cells (green, not red; dotted outlines).
(I–K) Control embryos do not exhibit addition of late-differentiating cells between 37 and 50 hpf (n = 34).
(L–N) In contrast, cadm4 morphants exhibit a population of green, but not red, OFT cells that initiated differentiation during this time frame (n = 42).
Scale bars, 50 μm. See also Figure S4.