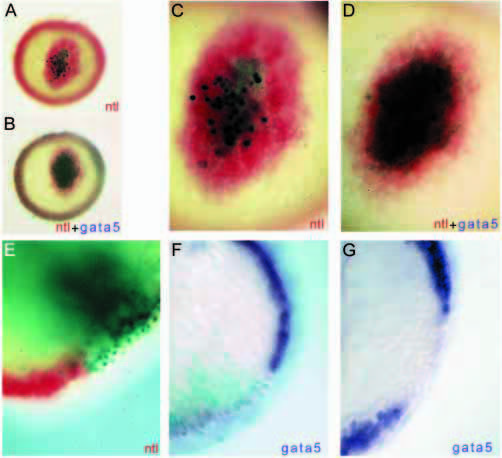
Fig. 6 Patterned response of gata5 and ntl expression to activin; dependence of both genes on TGF-β signalling. (A-D) 50% epiboly embryo coinjected at 16-32 cell stage with activin (10 mg/ml) and nls-β-gal (100 mg/ml) RNA. β-gal detected with X-Gal (turquoise nuclear staining). The embryo was photographed after staining for ntl (red) and again after detection of gata5 (blue; B,D). (A,B) Low magnification, animal pole views of the whole embryo. (C,D) Higher magnification views of the patch of ectopic expression. (C) ntl expression overlaps with the injected cells and extends 4-8 cell diameters beyond the cells injected. (D) gata5 is induced in injected cells and up to 2-3 cell diameters beyond them. A ring of cells expressing ntl alone extends for about 4 cell diameters beyond those coexpressing ntl and gata5, mimicking the normal pattern of expression of these genes. (E-G) Blastoderm margin, 50% epiboly embryos coinjected at 2-cell stage with 1 mg/ml dnXAR and 100 ng/ml nls-β-gal RNA. (E) Stained for ntl expression (red); (F) stained for gata5 expression (blue) after staining for β-gal activity and (G) gata5 stain without staining for β-gal to show more clearly the gap in gata5 expression. Expression of both genes is eliminated by inhibiting TGF-β signalling.
Image
Figure Caption
Acknowledgments
This image is the copyrighted work of the attributed author or publisher, and
ZFIN has permission only to display this image to its users.
Additional permissions should be obtained from the applicable author or publisher of the image.
Full text @ Development

