
Fig. 5
- ID
- ZDB-IMAGE-140305-44
- Genes
- Publication
- Prince et al., 1998 - Zebrafish hox genes: expression in the hindbrain region of wild-type and mutants of the segmentation gene valentino
- All Figures
- Figures for Prince et al., 1998
|
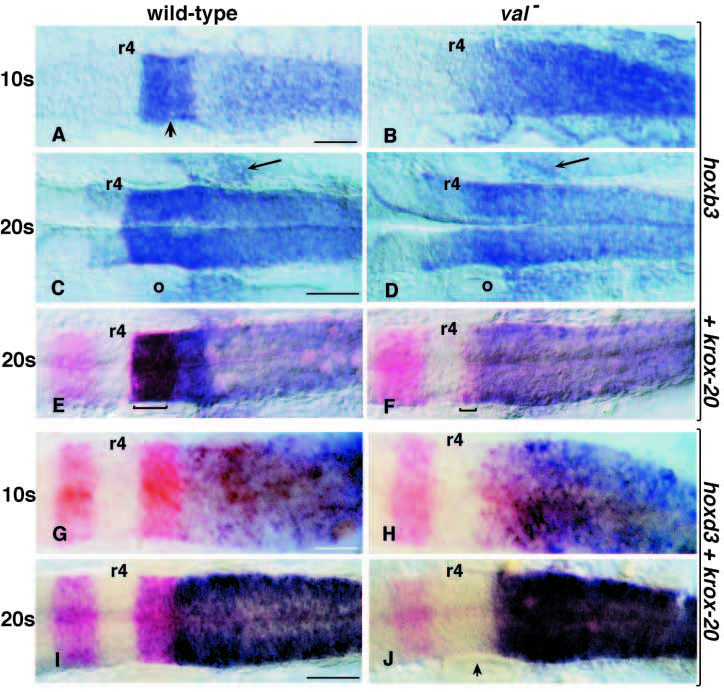
Fig. 5 Expression of paralogue group 3 genes in wild-type (A,C,E,G,I) and val- (B,D,F,H,J) embryos, r4 is indicated on each specimen. (A-F) In situ hybridization with hoxb3. At the 10s stage hoxb3 has a high level expression domain in r5+r6 (A, arrow indicates r4/5 boundary), this domain is lacking in the val- embryos (B). By the 20s stage a low level expression domain is apparent in r4 (C,D), high level expression continues in wild-type embryos in r5+r6 (C) next to the otic vesicle (o), the comparable rX expression in val- embryos continues to be at a significantly lower level (D). Neural crest cells migrating posterior to the otic vesicle and expressing hoxb3 are indicated with arrows. E and F show double in situ hybridizations with krox-20 at the 20s stage, to confirm rhombomere locations (the posterior krox-20 expression domains are bracketed in each case). (G-J) In situ hybridization with hoxd3 and krox- 20. In wild-type embryos at 10s (G) and 20s (I) hoxd3 expression reaches the r5/6 boundary to abut the r5 krox- 20 expression domain. In val- embryos at 10s (H) hoxd3 expression is maintained in rX where, similar to hoxb3, it does not overlap with the small rX krox-20 expression domain. At 20s (J) expression is confined to the posterior half of rX, arrowhead indicates the approximate location of the r4/rX interface. Note variable levels of krox20 expression in rX, as discussed in text (compare J with F). Scale bar, 50 μm, where no bar shown, scale is equivalent to adjacent or above panel.