
|
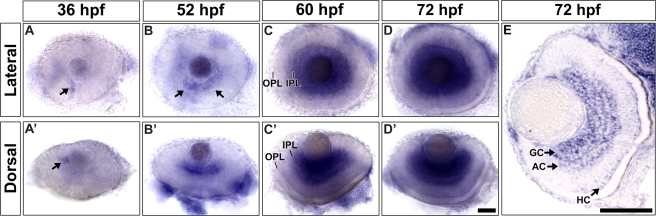
Fig. 1
The expression dynamics of p35 during zebrafish retinogenesis. A time-series whole-mount in situ hybridization was performed to detect the expression pattern of p35 in WT retina. The resulting eyes were dissected and imaged from the lateral and dorsal views. The signal of p35 was first detected in an anterior-ventral patch of the retina at around 36 hpf (A, A′; arrow). Then, it spread towards the dorsal side of the GCL and was mainly detected in this region at 52 hpf (B, B′; arrows). By 60 hpf, p35′s staining was detected in the GCL and AC region (C, C′). Faint staining in the apical INL began to appear at this stage, and became more conspicuous at 72 hpf (D, D′). This signal originated from HCs, as revealed by cryosectioning of the embryos at the same stage (E). In addition, the staining in the GCL and AC region became stronger than the earlier stages. GC, ganglion cells; AC, amacrine cells; HC, horizontal cells; IPL, inner plexiform layer; OPL, outer plexiform layer. For A–D, anterior is to the left and dorsal is up; for A′–D′, anterior is to the left and lateral is up; for E, lateral is to the left and dorsal is up. Scale bars = 50 μm.