
Fig. S3
- ID
- ZDB-IMAGE-140107-35
- Publication
- Fernandes et al., 2013 - Orthopedia Transcription Factor otpa and otpb Paralogous Genes Function during Dopaminergic and Neuroendocrine Cell Specification in Larval Zebrafish
- All Figures
- Figures for Fernandes et al., 2013
|
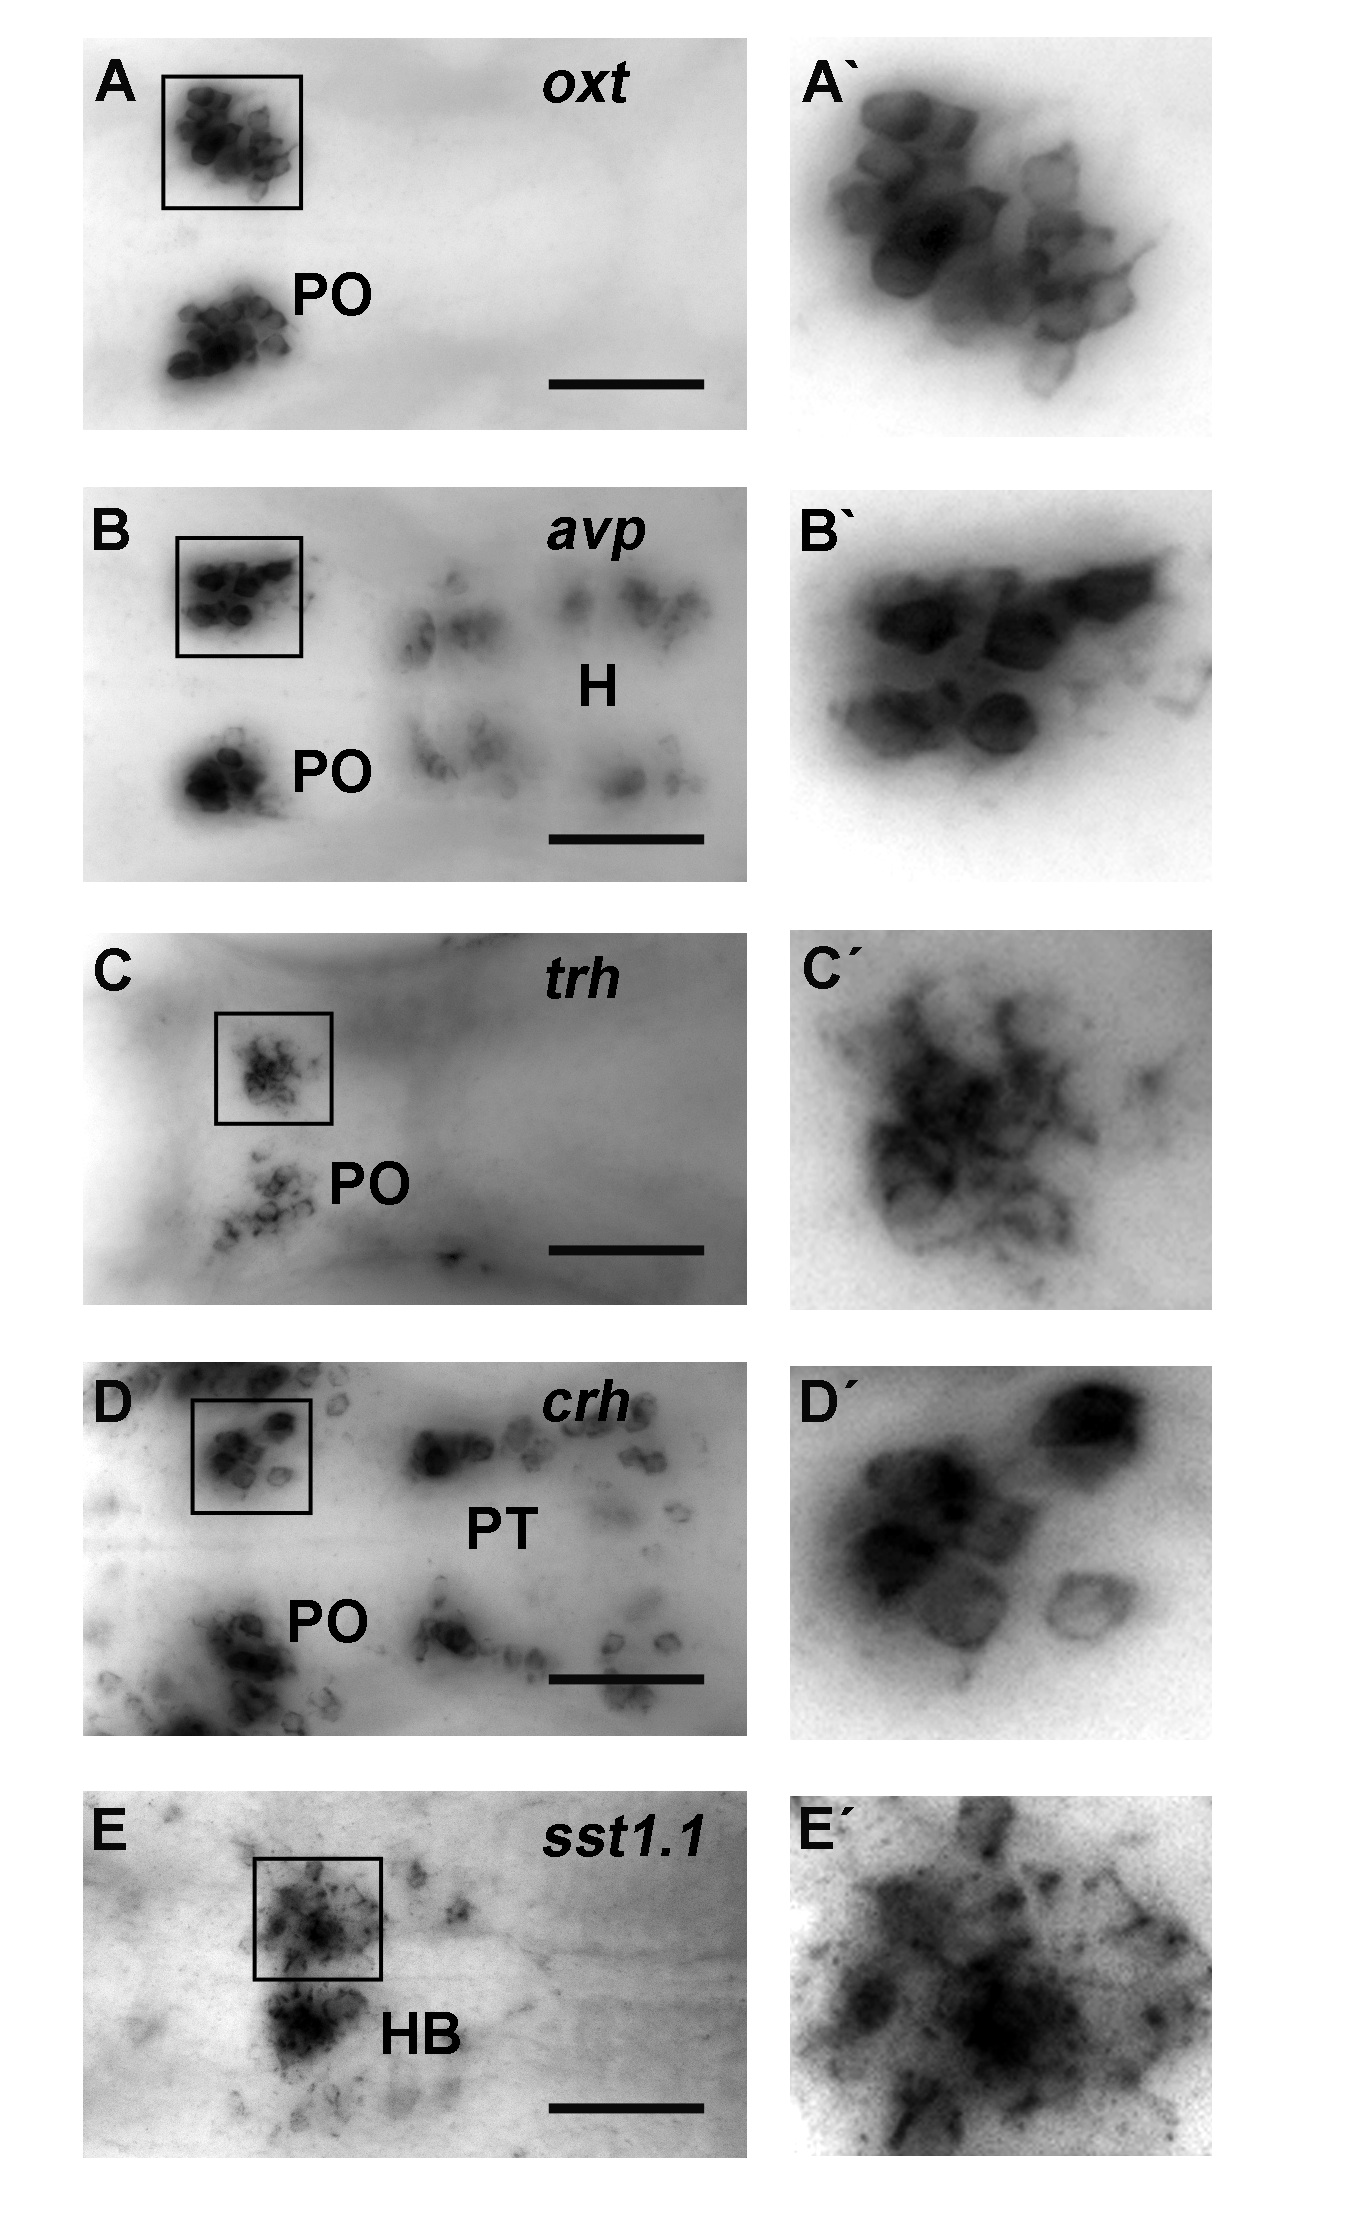
Fig. S3 High-resolution imaging of neuroendocrine cells for cell counting. Example of 3 dpf wildtype embryos imaged at single-cell resolution for quantification of cell numbers. (A) oxt, (B), avp, (C) trh, (D) crh expression analysis by WISH. For this figure, from the whole image stack with images at 1 μm spacing, sub-stacks of planes were used to generate a series of dorso-ventral Z-projections containing the region of interest. A higher magnification of regions of interest is shown on the right panel. Dorsal view, anterior at left. Scale bar is 100 μm. H, hypothalamus; HB, Hindbrain; PO, preoptic region; PT, posterior tuberculum.