
IMAGE
Fig. 3
Image
|
Figure Caption
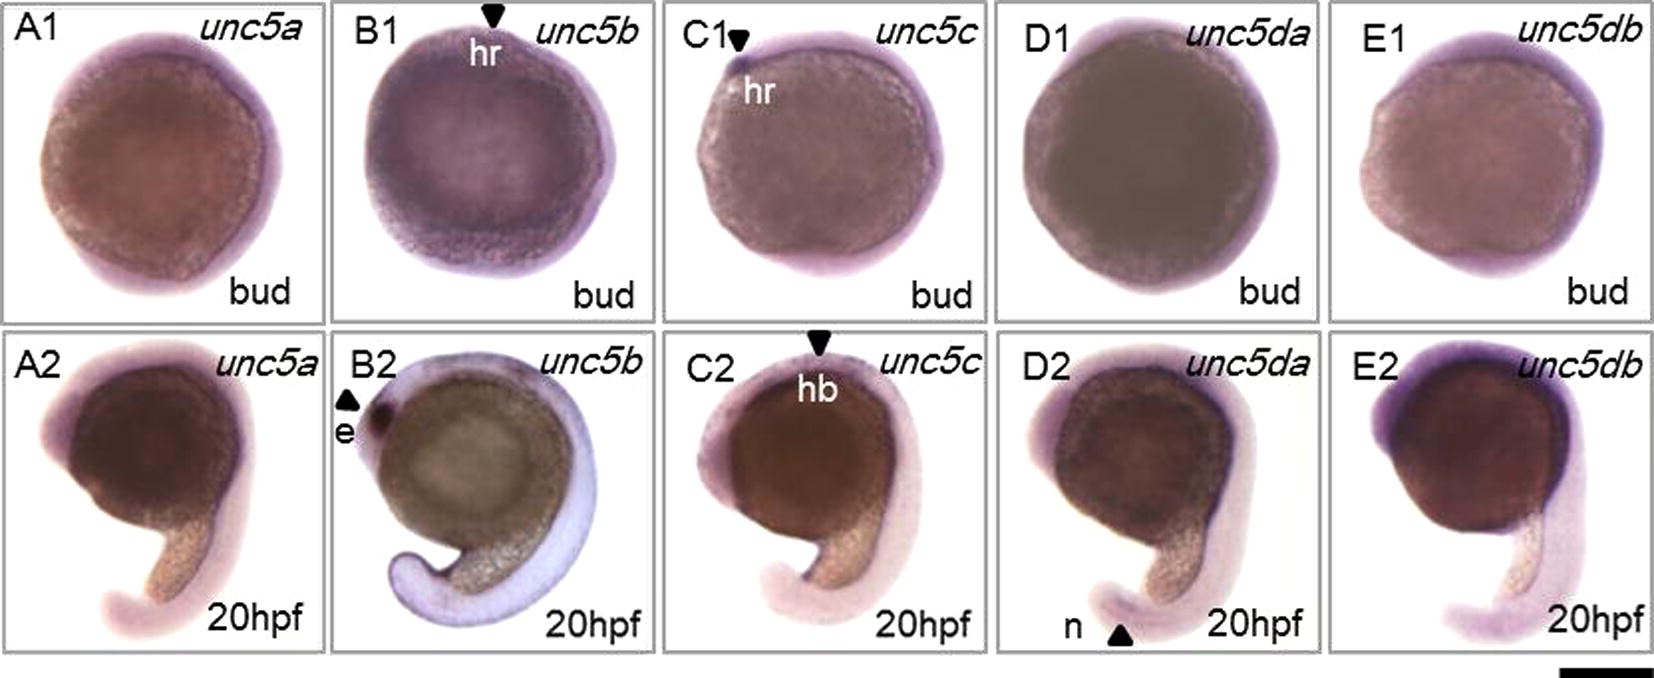
Fig. 3 Expression analysis of unc5a, unc5b unc5c, unc5da and unc5db at bud stage and 20 hpf by whole mount in situ hybridization. All embryos are in the lateral view and rostral to the left. The probes used for in situ hybridization are listed in the upper right corner of each panel. Developmental stages are indicated in the lower right corners. The arrow heads represent the head region, tail notochord and hindbrain as indicated. Abbreviations: hr, head region; hb, hind brain; n, notochord. Scale bar (under E2): A1–E1, 200 μm; A2–E2 250 μm.
Figure Data
Acknowledgments
This image is the copyrighted work of the attributed author or publisher, and
ZFIN has permission only to display this image to its users.
Additional permissions should be obtained from the applicable author or publisher of the image.
Reprinted from Gene expression patterns : GEP, 13(8), Yang, B., Peng, G., and Gao, J., Expression of unc5 family genes in zebrafish brain during embryonic development, 311-8, Copyright (2013) with permission from Elsevier. Full text @ Gene Expr. Patterns