
|
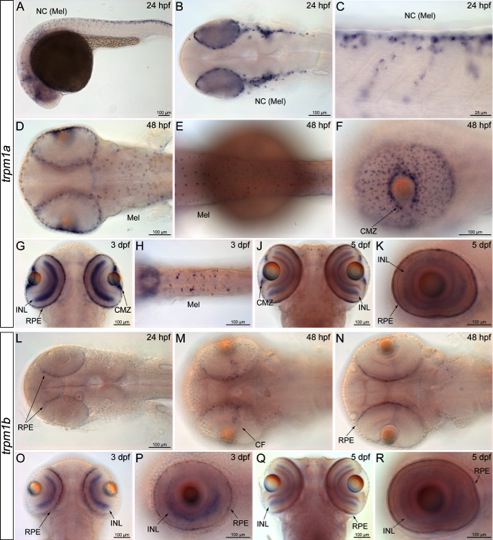
Fig. 2 Expression of trpm1a and trpm1b, shown in whole-mount during zebrafish development. A–K: trpm1a expression. A–C: Lateral (A,C) and dorsal (B) views of embryos 24 hpf, of which C shows dorsal and lateral NC cells of the tail in higher magnification. D–F: Dorsal (D,E) and lateral (F) views of embryos staged 48 hpf. G,H: The 3 dpf larvae shown from the ventral side. J,K: Ventral (J) and lateral (K) views of larvae staged 5 dpf. L–R: trpm1b expression with L: dorsal view of embryos 24 hpf. M,N: Embryos staged 48 hpf shown from the dorsal side. O,P: Ventral (O) and lateral (P) views of larvae 3 dpf. Q,R: Ventral (Q) and lateral (R) views of larvae 5 dpf. Zebrafish are orientated with anterior to the left in all pictures but G, J, O, and Q, where anterior is to the top. Scale bars of 100 μm are indicated in the first picture of a series until changed. Scale bar in C = 25 μm. NC, neural crest; Mel, melanoblast/-cyte; CMZ, ciliary marginal zone; INL, inner nuclear layer; RPE, retinal pigment epithelium; CF, choroid fissure.