
Fig. 4
- ID
- ZDB-IMAGE-131211-59
- Genes
- Antibodies
- Publication
- Arrington et al., 2013 - Sdc2 and Tbx16 regulate Fgf2-dependent epithelial cell morphogenesis in the ciliated organ of asymmetry
- All Figures
- Figures for Arrington et al., 2013
|
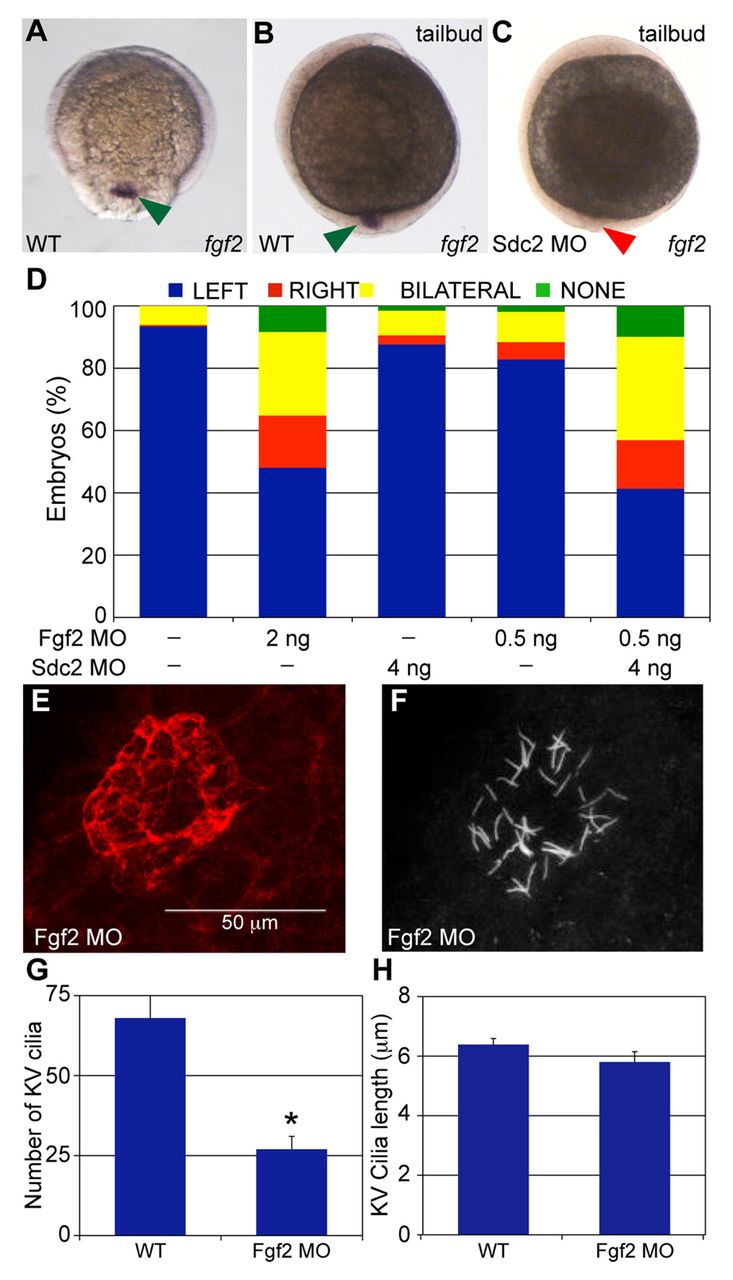
Fig. 4 Sdc2 controls KV morphogenesis through Fgf2 in DFCs/KV. (A,B) In wild-type zebrafish embryos, fgf2 (arrowheads) is expressed (A) in DFCs at 80% epiboly (dorsal view) and (B) in the forming KV at tailbud stage (lateral view). (C) In sdc2 morphants, fgf2 expression is significantly reduced in KV cells (lateral view). (D) fgf2 morphants (2 ng MO) had randomized spaw expression (n=244), similar to that seen in sdc2 morphants (see Fig. 1E). Synergy between Sdc2 and Fgf2 was tested by comparing the effects of subthreshold amounts of each MO individually [4 ng sdc2 SB2 MO (n=431) and 0.5 ng fgf2 MO (n=475)] with co-injection of both MOs. Spaw expression patterns were significantly altered by co-injection of subthreshold doses of sdc2 SB2 and fgf2 MOs [n=486; P<0.001 compared with individual low-dose morphants]. (E,F) fgf2 morphants had smaller KVs (E; labeled with anti-ζPKC antibody) than wild-type embryos, whereas cilia (F, labeled with anti-tubulin antibody) were of normal length. (G,H) Quantification of cilia number and length: cilia number but not cilia length was decreased in fgf2 morphants (wild type: eight embryos, 547 cilia; fgf2 morphants: 11 embryos, 299 cilia), *P<0.001. Error bars indicate s.e.m. P-values by Student’s t-test.