
Fig. 6
- ID
- ZDB-IMAGE-131107-13
- Publication
- Andersson et al., 2012 - Adenosine Signaling Promotes Regeneration of Pancreatic beta Cells In Vivo
- All Figures
- Figures for Andersson et al., 2012
|
Fig. 6
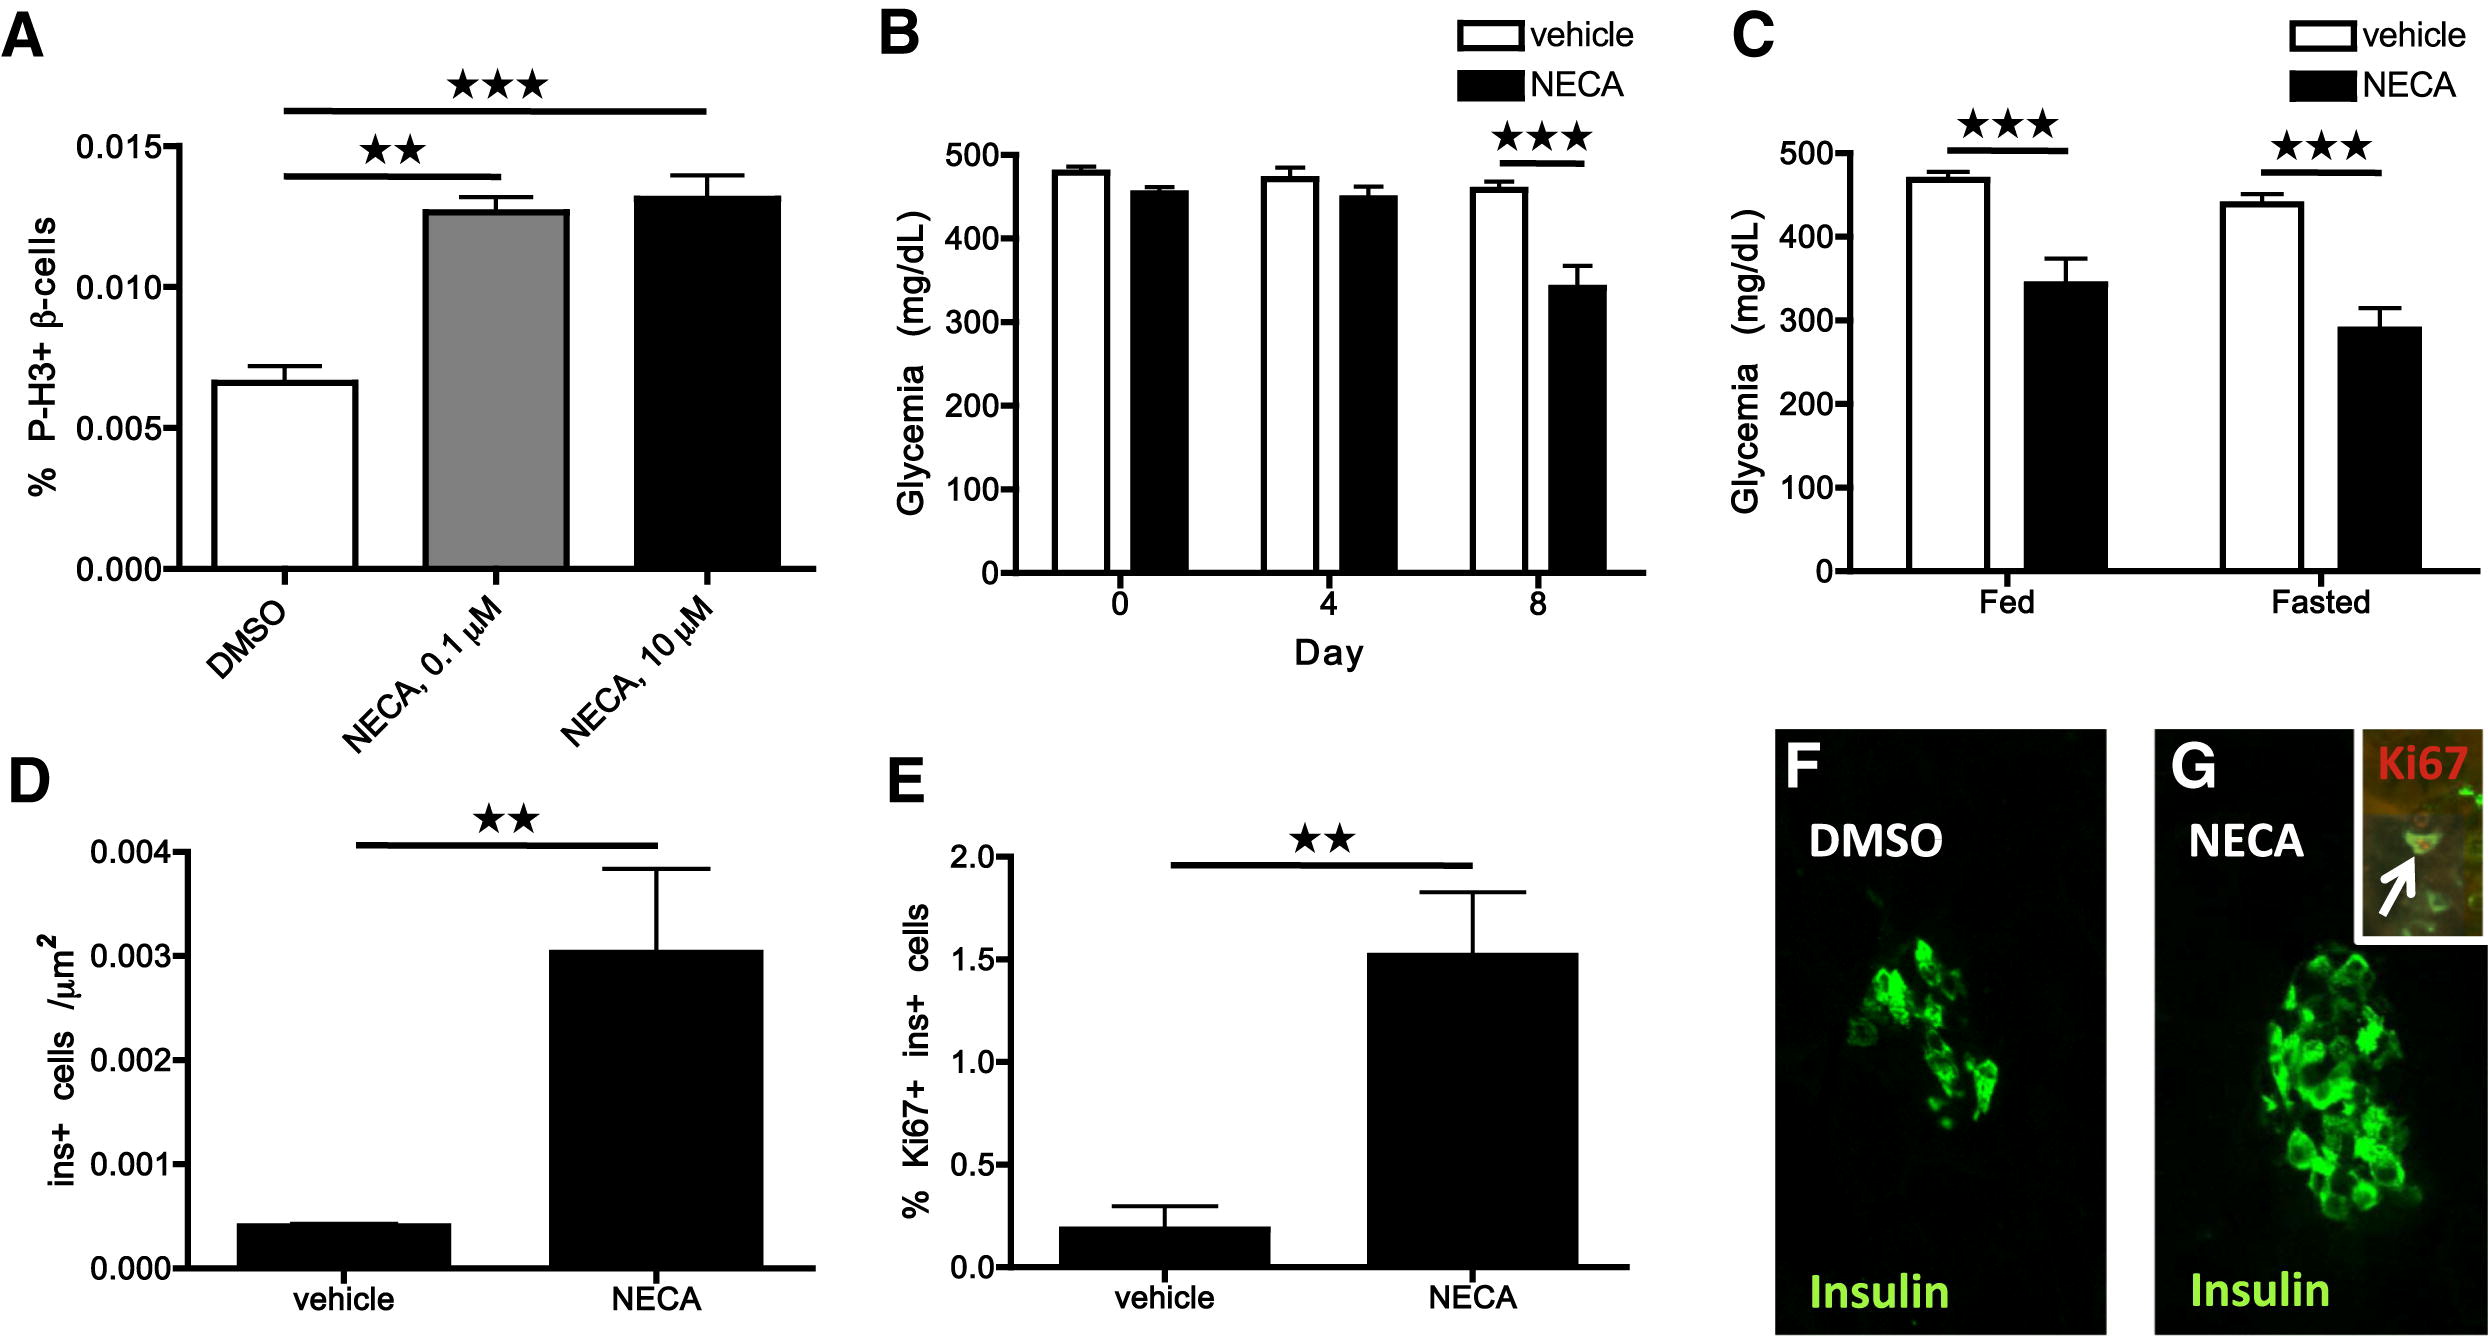
NECA Enhances Murine β Cell Proliferation and Glucose Control after STZ-Induced Diabetes
(A) Proliferation rate of β cells, displayed as percentage of P-H3-labeled β cells, in isolated mouse islets following 4 days of vehicle or NECA treatment. p < 0.01 for 0.1 μM NECA; p < 0.001 for 10 μM NECA.
(B) Blood glucose levels after STZ-induced diabetes and subsequent treatment with vehicle or NECA for 8 days. The blood glucose levels were determined in fed mice. p < 0.001; n = 21 mice for vehicle treated; n = 18 mice for NECA treated.
(C) Blood glucose levels in fed and fasted state of STZ-injected mice after 15 days of treatment with vehicle or NECA. p < 0.001; n = 14 mice for vehicle treated; n = 10 mice for NECA treated.
(D) β cell mass as determined by the number of insulin-positive cells per unit area (Ins+ cell per μm2) in STZ-injected mice after 15 days of vehicle or NECA treatment. p = 0.0058; n = 5 mice per group.
(E) Proliferation of insulin-expressing cells in STZ-injected mice following vehicle or NECA treatment. Quantification of the percent of insulin-positive cells that colabeled with Ki67. p = 0.0019; n = 5 mice per group.
(F and G) Representative images of islets in STZ-injected mice after 15 days of vehicle (F) or NECA treatment (G). A Ki67+ Ins+ cell (arrow) in a NECA-treated mouse is shown in the inset (G). Error bars represent SEM.
Reprinted from Cell Metabolism, 15(6), Andersson, O., Adams, B.A., Yoo, D., Ellis, G.C., Gut, P., Anderson, R.M., German, M.S., and Stainier, D.Y., Adenosine Signaling Promotes Regeneration of Pancreatic beta Cells In Vivo, 885-894, Copyright (2012) with permission from Elsevier. Full text @ Cell Metab.