
Fig. S2
- ID
- ZDB-IMAGE-130830-6
- Publication
- Ninov et al., 2013 - Metabolic Regulation of Cellular Plasticity in the Pancreas
- All Figures
- Figures for Ninov et al., 2013
|
Fig. S2
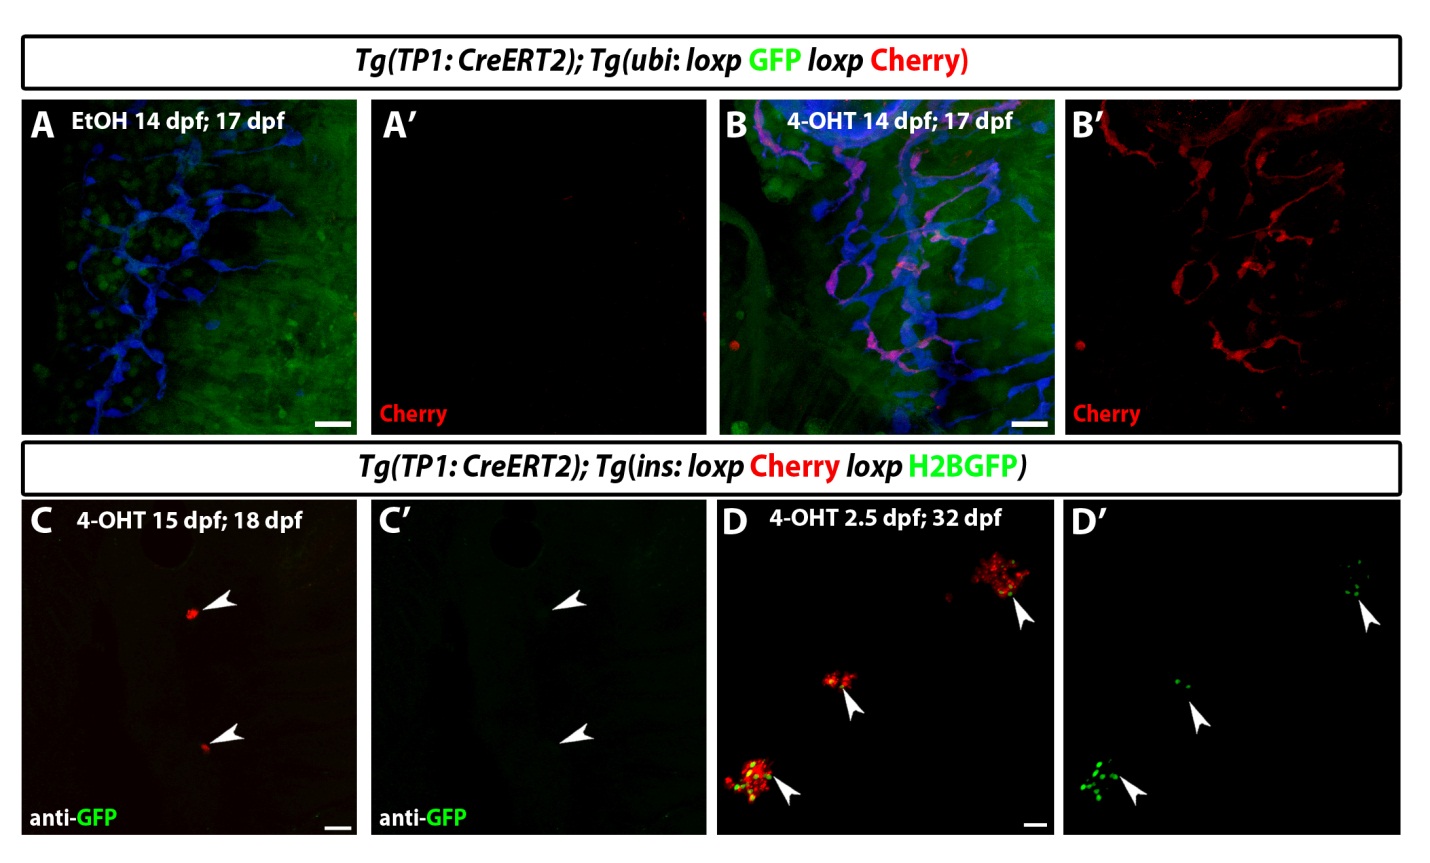
Differentiation of β Cells from Notch Responsive Cells during Juvenile Stages, Related to Figure 2
(A and B) Tg(TP1:CreERT2);Tg(ubi3C:loxp-GFP-loxp:mCherry) larvae were treated with EtOH as vehicle (A) or 4-OHT (B) at 14dpf for 16h, fixed at 17dpf, and stained for 2F11 to mark the IPD cells. 4-OHT treatment resulted in the mosaic labeling of IPD cells (mCherry+; 2F11+ cells).
(C) Tg(TP1:CreERT2);Tg(insulin:loxP:mCherry-STOP:loxP:H2BGFP) larvae treated with 4-OHT at 15dpf for 24h; the pancreata were analyzed at 18dpf without switching to a high-calorie diet, and after staining with anti-GFP antibodies. No H2BGFP+ β-cells were observed in the SIs (19 islets in 30 animals).
(D) Tg(TP1:CreERT2);Tg(insulin:loxP:mCherry-STOP:loxP:H2BGFP) larvae treated with 4-OHT at 2.5dpf for 24h; the pancreata were analyzed at 32dpf. The SIs (arrowheads) are composed of mCherry+ β-cells as well as H2BGFP+ β-cells. Note that the H2BGFP+ β-cells in the SIs formed groups of several cells, indicating that they underwent amplification after differentiation. Scale bars, 20 μm.