
Fig. S1
- ID
- ZDB-IMAGE-130828-14
- Genes
- Antibodies
- Publication
- Zhao et al., 2013 - Reptin/Ruvbl2 is a Lrrc6/Seahorse interactor essential for cilia motility
- All Figures
- Figures for Zhao et al., 2013
|
Fig. S1
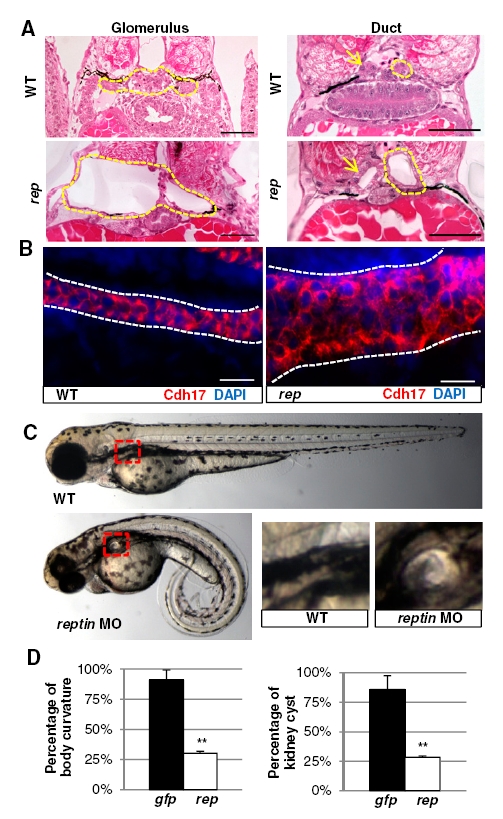
Reptinhi2394 mutants and reptin morphants display cilia-associated phenotypes. (A) Cross-sections of the glomerular–tubular region and the posterior pronephric duct region of a reptinhi2394 mutant (rep) and a wild-type sibling (WT) at 5 dpf. Yellow dotted lines show the border of the glomerular–tubular region on the Left and the duct on the Right; yellow arrows point to the duct on the Left. (Scale bar, 50 μm.) (B) Whole-mount immunostaining with anti-Cdh17 (Cdh17, red) showing increased diameter of the pronephric duct (bordered by white line) in a side view of a reptinhi2394 mutant (rep) compared with a wildtype embryo (WT) at 4 dpf. (Scale bar, 20 μm.) (C) Reptin morphant (rep MO) at 3 dpf displaying kidney cyst (red box) and body curvature, compared with a control MO injected embryo (WT). The kidney regions are magnified at Lower Right. (D) Wild-type embryos coinjected with reptin MOs and reptin (with 5 mismathed nucleotides) mRNA (rep) showing reduced percentages of body curvature (Left) and kidney cyst (Right), compared with the reptin MOs and eGFP mRNA coinjection group (gfp). Data are represented as mean + SD from three replicates. **P < 0.01.