
Image
|
Figure Caption
Fig. 7
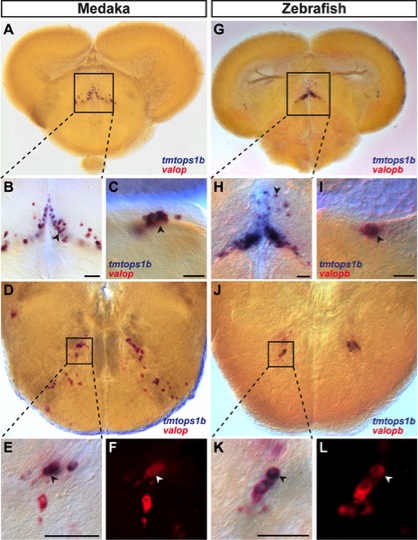
Two-color ISH of tmt-opsin1b (blue) and val-opsins (red/red fluorescence) on coronal medaka (A–F) and zebrafish (G–L) sections. Magnifications are indicated as boxes. Scale bars, 50 μm. Tmtops1b and valopb co-expression in the central posterior thalamic nucleus of medaka (A–B) and zebrafish (G–H), in the dorsal tegmental nucleus in medaka (C) and zebrafish (I) and in the facial nerve nucleus in medaka (D–F) and zebrafish (J–L).
Figure Data
Acknowledgments
This image is the copyrighted work of the attributed author or publisher, and
ZFIN has permission only to display this image to its users.
Additional permissions should be obtained from the applicable author or publisher of the image.
Full text @ PLoS Biol.