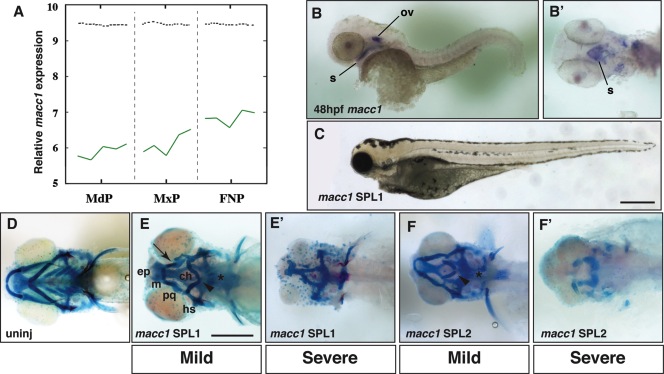
Fig. 5 Analysis of macc1 expression and function in the larval zebrafish head. A: Microarray analysis of Macc1 expression in the embryonic mouse face. Expression increases in the mandibular (MdP), maxillary (MxP), and frontonasal (FNP) prominences between E10.5 to E12.5. The x-axis represents the five time points for each prominence. The y-axis shows the relative expression level on a log2 scale, i.e., every integer represents a doubling in the level of expression from the preceding number. The dashed black line indicates the average expression level for all probes. B: In situ hybridization for macc1 at 48hpf. Lateral view shows macc1 expression in the otic vesicle (ov) and developing mouth (s). B′: Ventral view after removal of the yolk to more clearly show macc1 expression in the roof of the stomodeum (s). C: Lateral view of 5dpf zebrafish after injection of 7.5 ng macc1 SPL1. The head and eyes of macc1 morphants are hypoplastic. D: Ventral view of the craniofacial skeleton of an uninjected larva at 5dpf. E: Ventral view of mild phenotypes associated with injection of 5 ng macc1 SPL1 Morpholino. E′: Ventral view of severe phenotypes associated with injection of 10 ng SPL1 macc1 Morpholino. F: Ventral view of mild phenotypes associated with injection of 10 ng macc1 SPL2 Morpholino. F′: Ventral view of severe phenotypes associated with injection of 20 ng SPL2 macc1 Morpholino. Defects in the ceratobranchials (asterisk), the ceratohyals (arrowhead), and Meckel′s and palatoquadrate cartilages resulting in a recessed lower jaw (arrow) are indicated. Other abbreviations as in Figure 1.
Image
Figure Caption
Figure Data
Acknowledgments
This image is the copyrighted work of the attributed author or publisher, and
ZFIN has permission only to display this image to its users.
Additional permissions should be obtained from the applicable author or publisher of the image.
Full text @ Dev. Dyn.

