
|
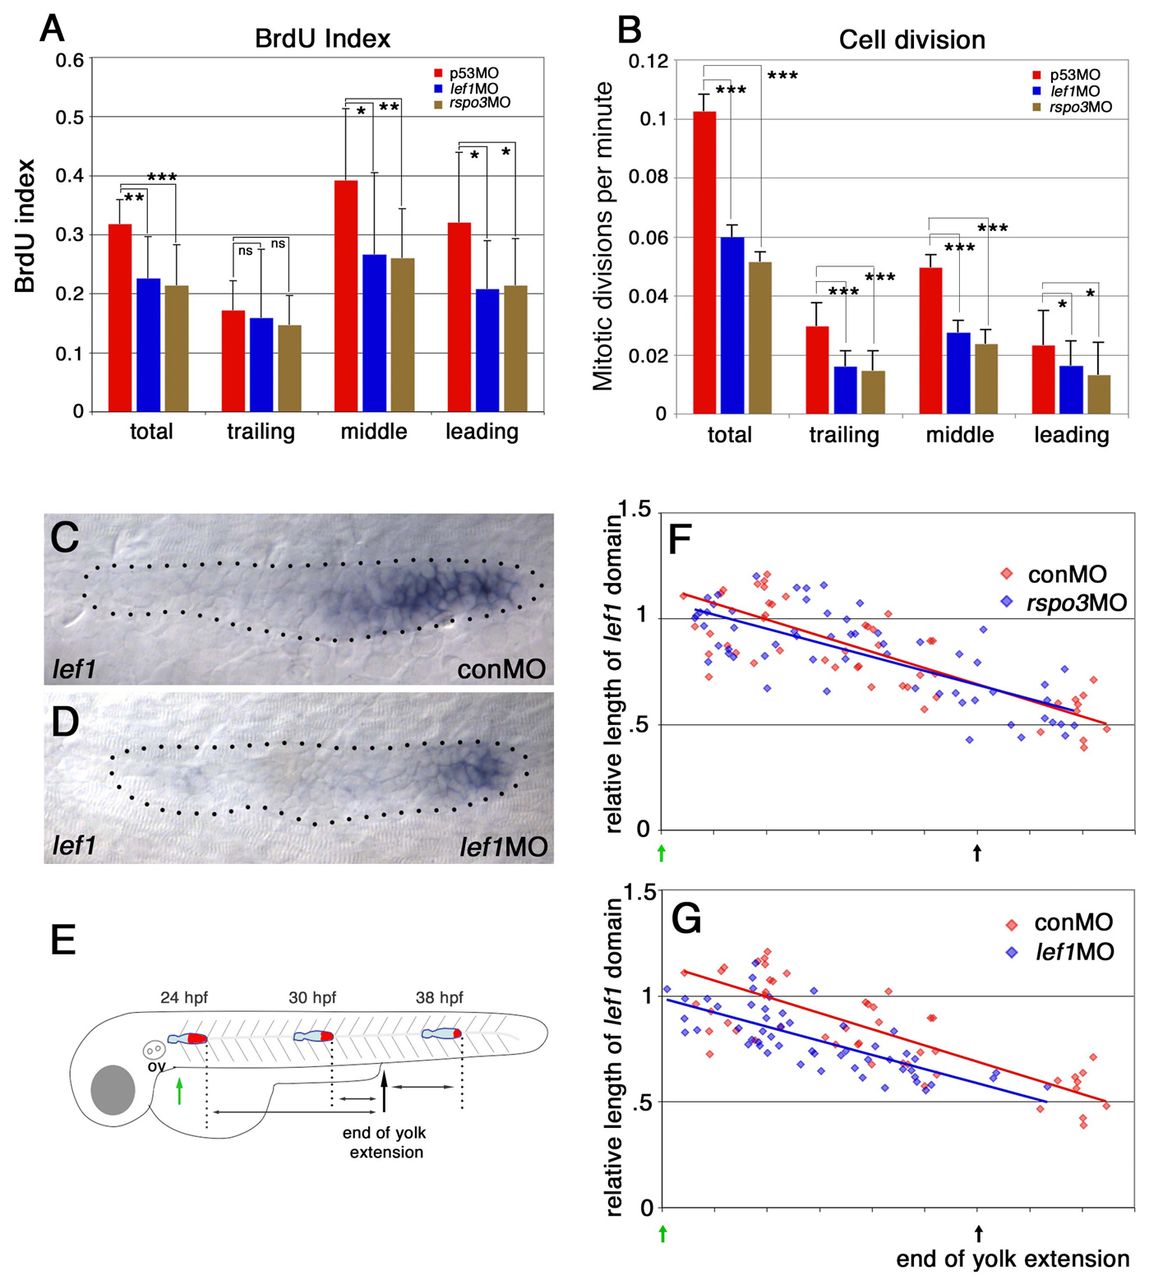
Fig. 2 Although rspo3 and lef1 morphants have similar changes in cell proliferation, the size of the lef1 expression domain is only reduced in lef1 morphants. (A,B) Knockdown of lef1 and of rspo3 reduce proliferation in a similar manner. (A) Total and regional BrdU incorporation index in the PLLp of control, lef1 morphant and rspo3 morphant embryos (see also supplementary material Table S1). (B) Total and regional cell division in the PLLp of control, lef1 morphant and rspo3 morphant embryos. ns, non-significant (P>0.05); *P<0.05, **P<0.01, ***P<0.001 (see also supplementary material Table S2). Error bars indicate s.d. (C,D) The lef1 expression domain is smaller in lef1 morphants at 31 hpf. For statistical analysis, see supplementary material Fig. S5D. (E) The progressive change in the size of the lef1 domain (red) over the course of PLLp migration. (F,G) Size of the lef1 domain (relative to its average length in control embryos at 24 hpf) plotted against the position of the PLLp along the trunk for a collection of embryos fixed between 24 and 38 hpf (see schematic in E). Red dots indicate control-MO-injected embryos and blue dots indicate either rspo3 (F) or lef1 (G) morphant embryos. Red or blue lines indicate the associated linear regression lines for each data set. A simple linear regression model and a paired t-test confirmed that the length of the lef1 domain is significantly reduced in lef1 morphants (P<0.001).