
IMAGE
Fig. 7
- ID
- ZDB-IMAGE-130509-15
- Publication
- Tao et al., 2013 - Def functions as a cell autonomous factor in organogenesis of digestive organs in zebrafish
- All Figures
- Figures for Tao et al., 2013
Image
|
Figure Caption
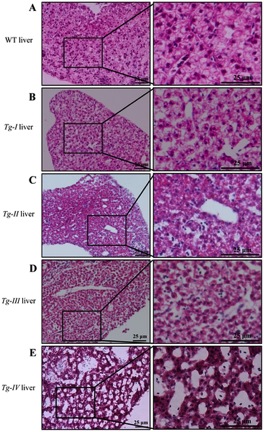
Fig. 7 Def over-expression disrupts the intrahepatic structure.
(A–E) H&E staining of the liver tissues from 3 months old fish of WT (A), Tg-I (B), Tg-II (C), Tg-III (D) and Tg-IV (E) showed that hepatocytes were loosely connected to each other and large gaps was formed in all four lines when compared to the liver tissue in the WT control. Panels on the left: view of the liver tissue at low power of magnification; panels on the right: high power of magnification view of the region boxed in the corresponding panels on the left as indicated.
Figure Data
Acknowledgments
This image is the copyrighted work of the attributed author or publisher, and
ZFIN has permission only to display this image to its users.
Additional permissions should be obtained from the applicable author or publisher of the image.
Full text @ PLoS One