
Fig. 1
- ID
- ZDB-IMAGE-130326-54
- Genes
- Publication
- Zhang et al., 2013 - The Role of egr1 in Early Zebrafish Retinogenesis
- All Figures
- Figures for Zhang et al., 2013
|
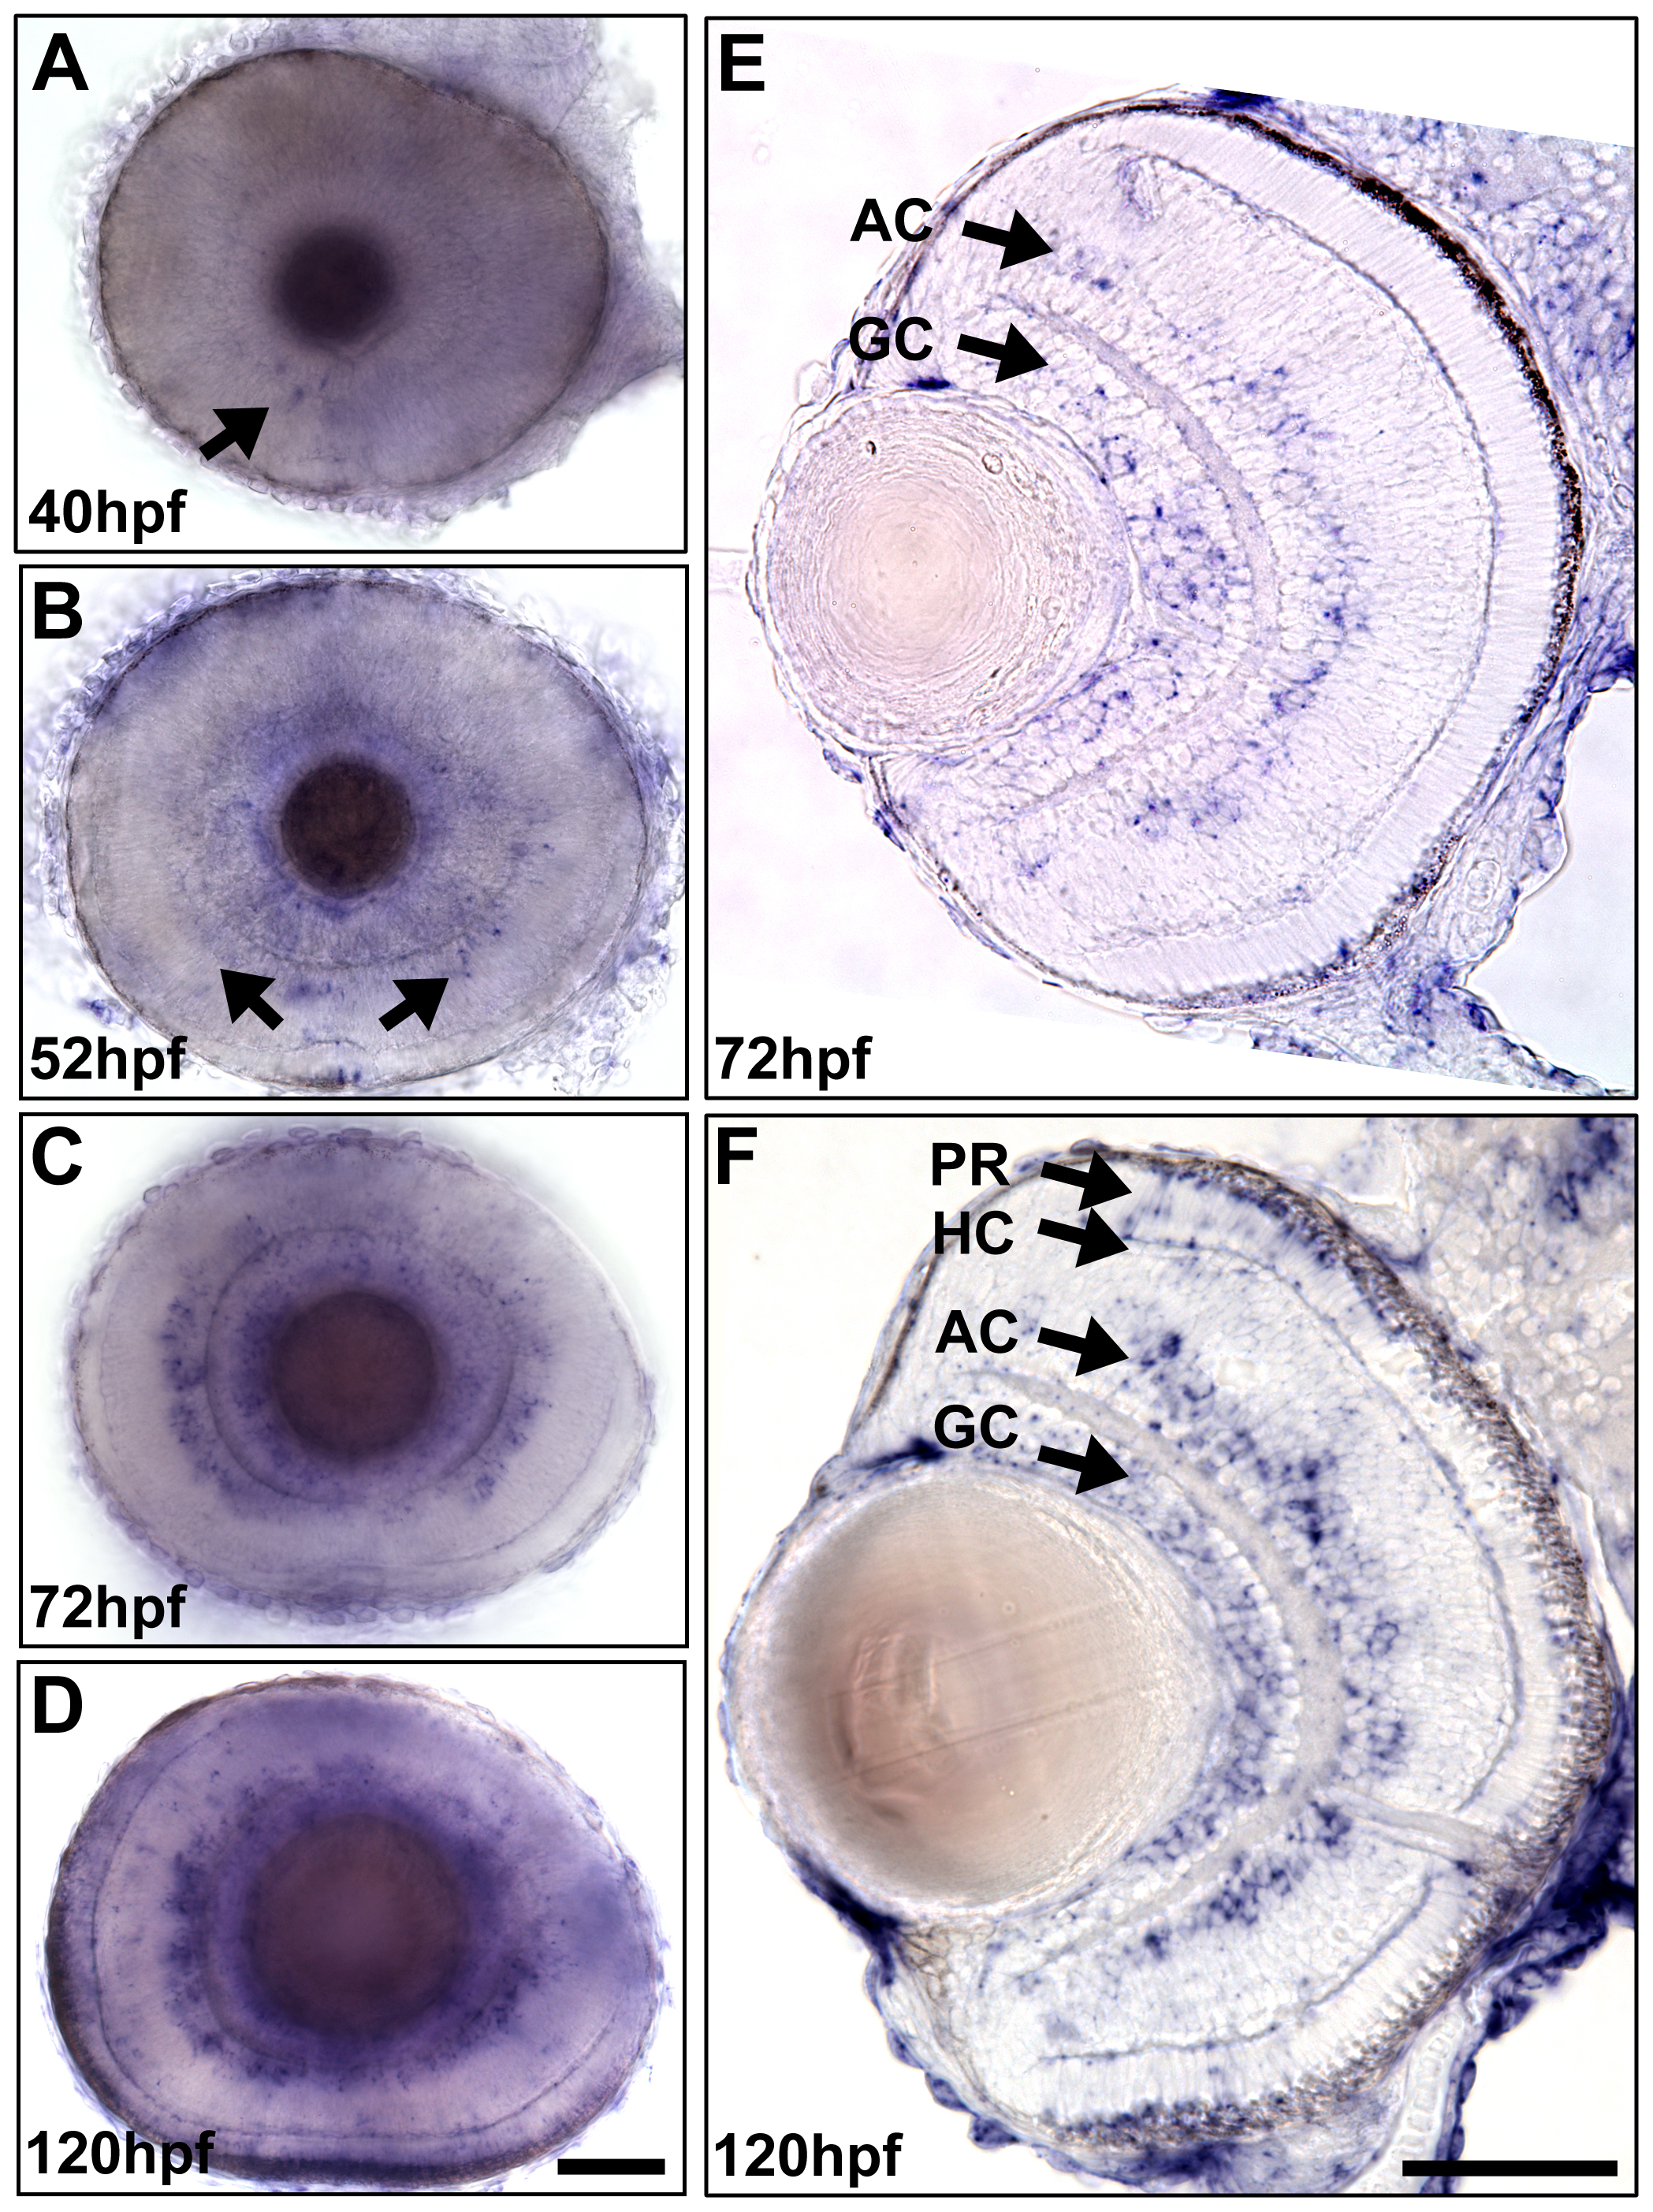
Fig. 1 The expression dynamics of egr1 during zebrafish retinogenesis.
A time-series whole-mount in situ hybridization was performed to detect the expression pattern of egr1 in the WT retina. The signal of egr1 was first detected in the anterior-ventral retina at 40 hpf (A, arrow). Then, egr1 expression spread to the dorsal retina at 52 hpf (B, arrows). At 72 hpf (C & E), strong signal was detected in the AC and GC regions. Occasionally, positive staining was observed in the HC and PR regions, but it did not become prominent in the peripheral outer retina until 120 hpf (D & F). At this stage, the signal was relatively intense in the GCL and AC region. GC: ganglion cells; AC: amacrine cells; HC: horizontal cells; PR: photoreceptors. Scale bars = 50 µm.