
Fig. 1
- ID
- ZDB-IMAGE-130320-14
- Genes
- Publication
- Choi et al., 2013 - In vivo monitoring of cardiomyocyte proliferation to identify chemical modifiers of heart regeneration
- All Figures
- Figures for Choi et al., 2013
|
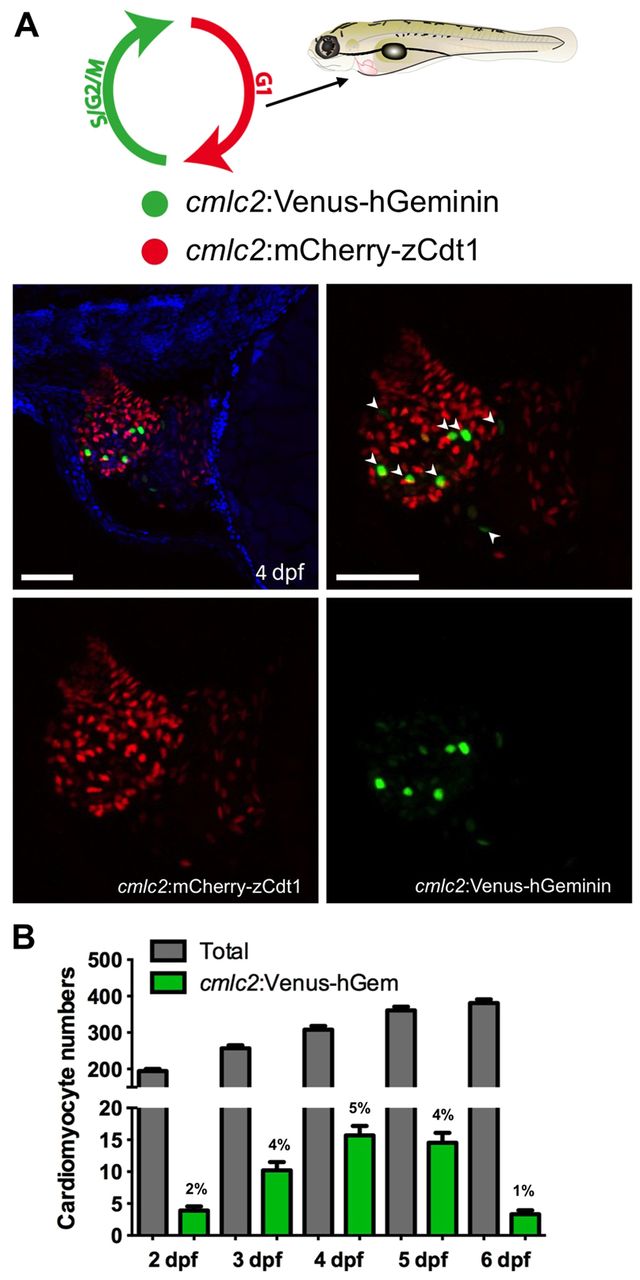
Fig. 1 FUCCI zebrafish for visualizing cardiomyocyte proliferation. (A) Representative maximum intensity projection of the heart of a 4 dpf cmlc2:FUCCI transgenic larva, visualizing non-proliferating (cmlc2:mCherry-zCdt1, red) and proliferating (cmlc2:Venus-hGeminin, green) cardiomyocytes, as depicted in the schematic at the top. Cardiomyocytes with only the Venus-hGeminin signal (arrowheads) were considered to be proliferating. DAPI, blue. Scale bars: 50 μm. (B) Time course of total (red+ and green+) and proliferating (green+) cardiomyocytes from 2 to 6 dpf. Percentages of proliferating cardiomyocytes are indicated above bars. Data are represented as mean±s.e.m. n=13-24 embryos per stage.