
Image
|
Figure Caption
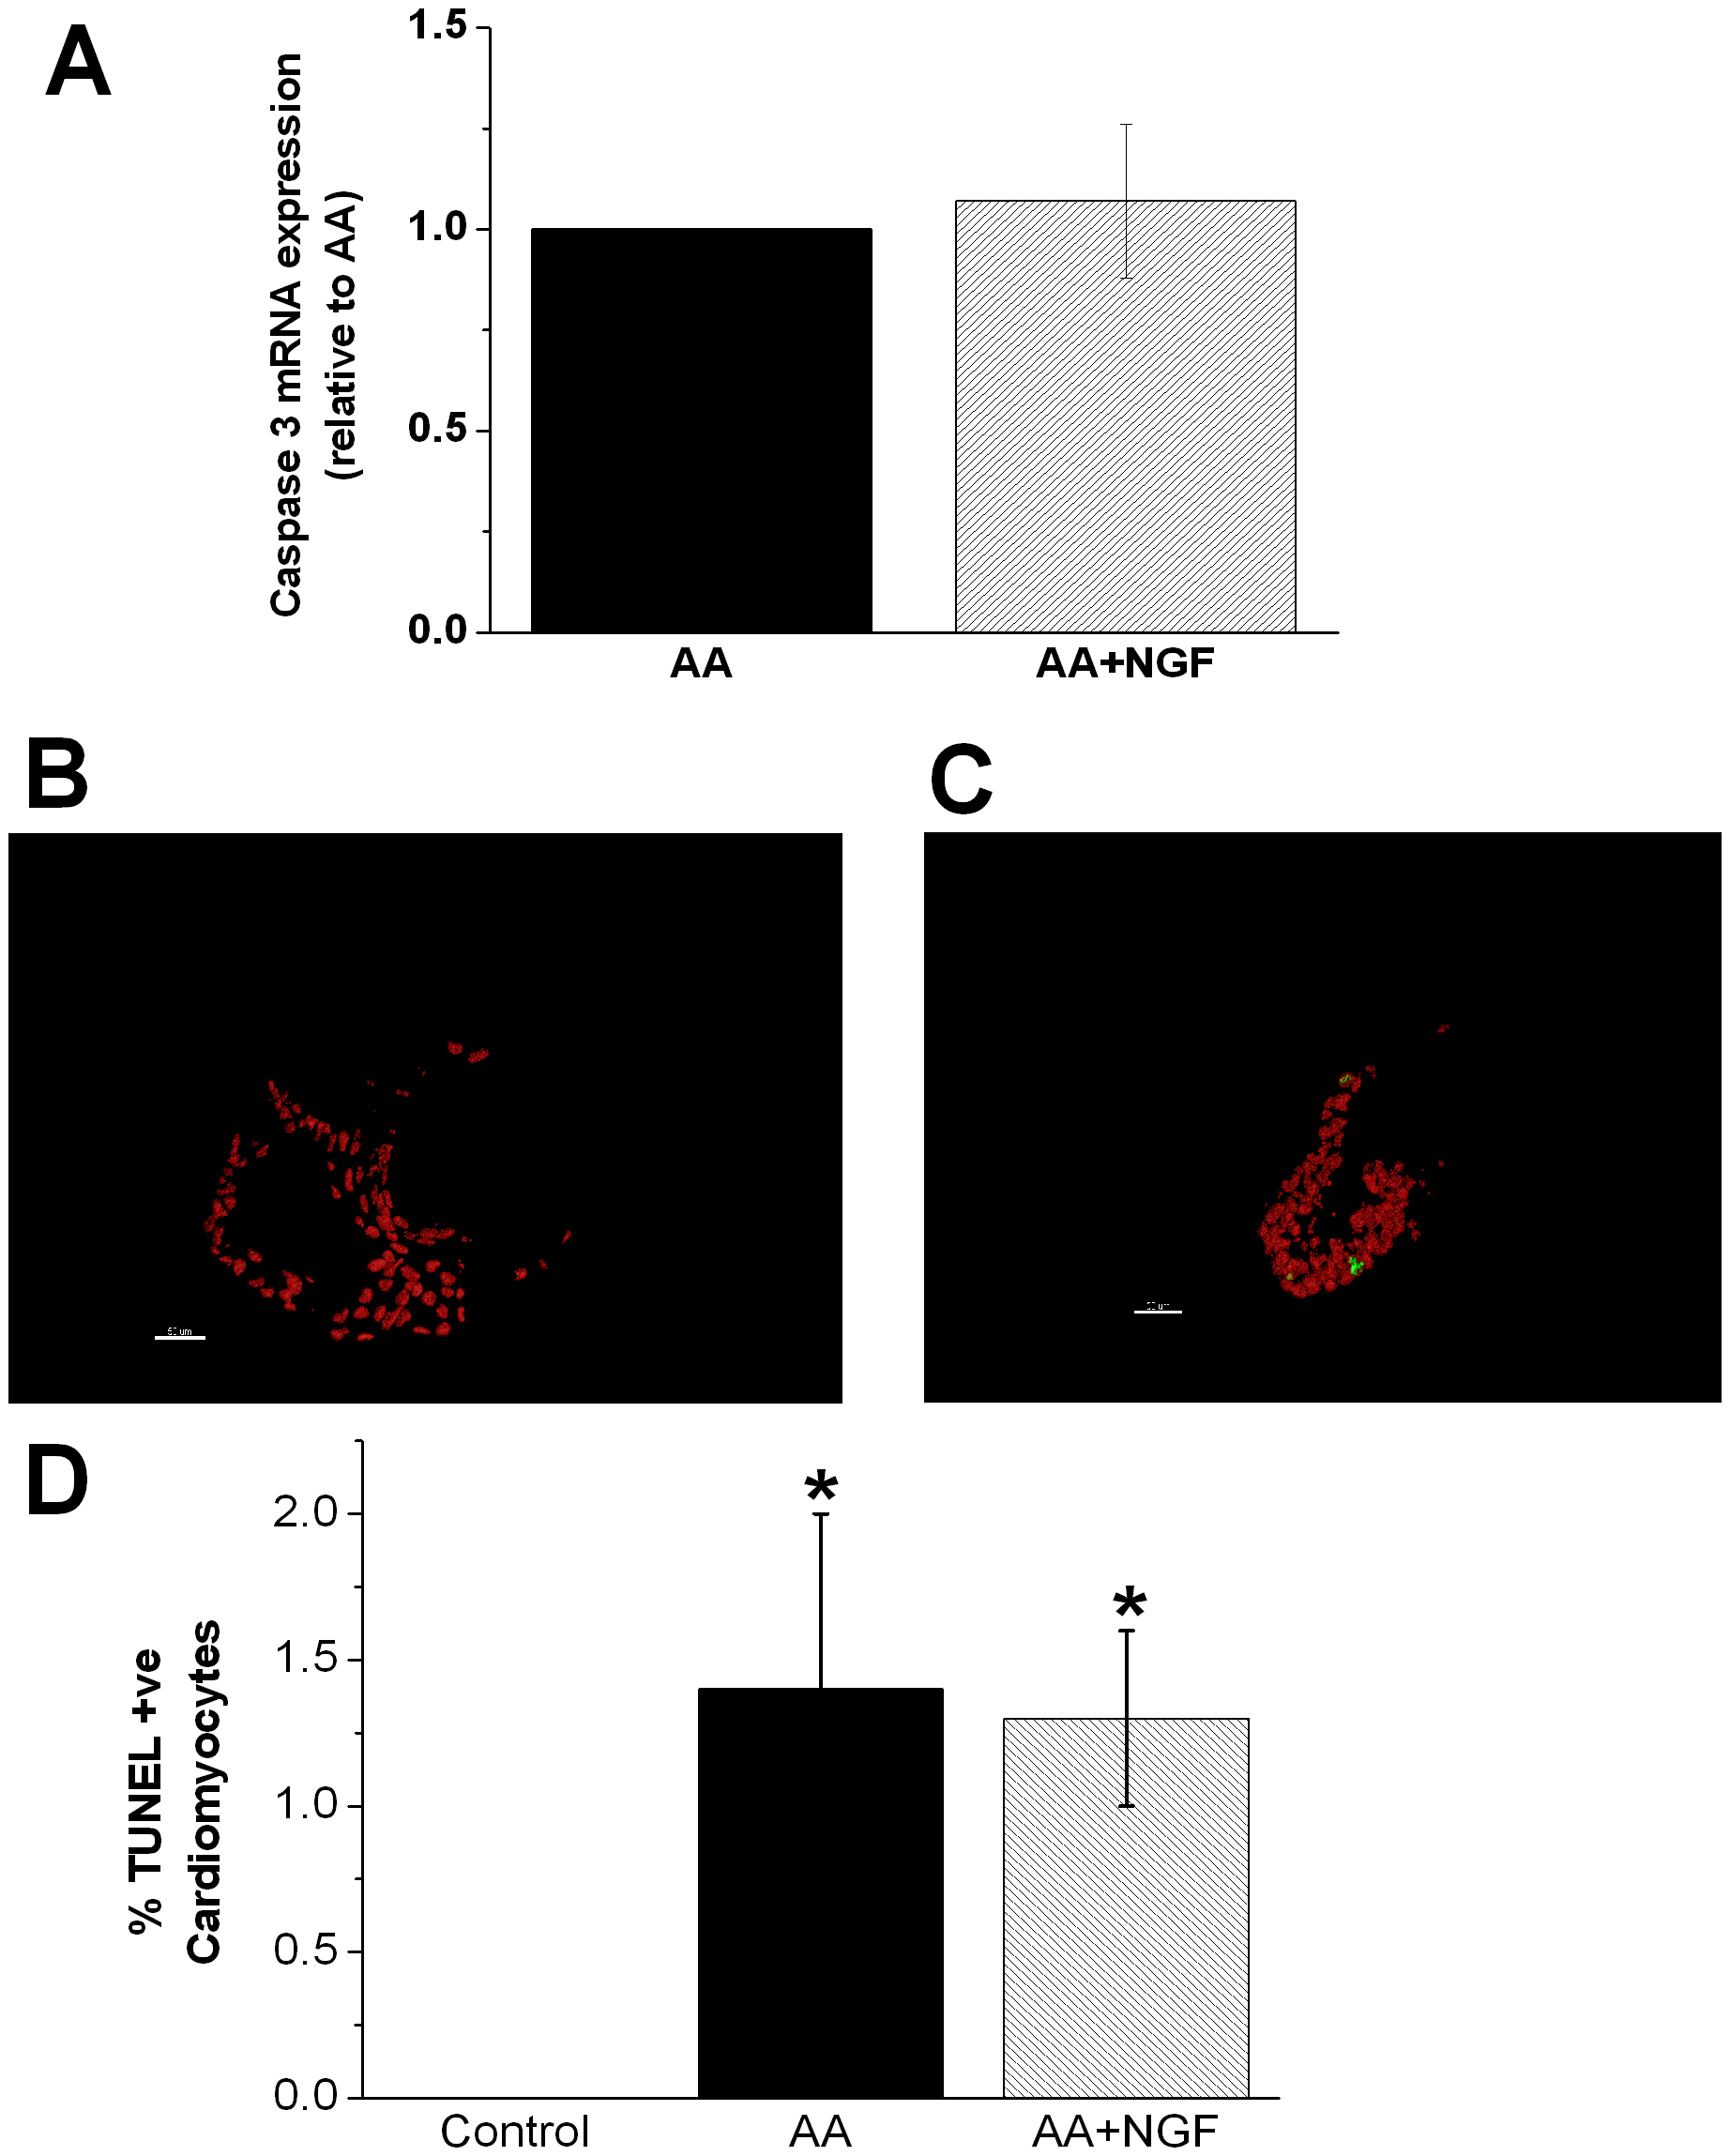
Fig. 4 NGF does not attenuate AA induced apoptosis.
A. Bar graph represents absence of effect of NGF on caspase 3 mRNA expression in AA treated (72–75 hpf) zebrafish hearts at 96 hpf. B and C. Representative IMARIS images of cardiomyocyte TUNEL staining in control and AA treated zebrafish heart at 100 hpf. Scale bar = 50 µm. D. Bar graph showing quantitative analysis of TUNEL staining (n = 6 per group, * p<0.05 vs control).
Figure Data
Acknowledgments
This image is the copyrighted work of the attributed author or publisher, and
ZFIN has permission only to display this image to its users.
Additional permissions should be obtained from the applicable author or publisher of the image.
Full text @ PLoS One