
Fig. 2
- ID
- ZDB-IMAGE-130218-15
- Genes
- Publication
- Nikaido et al., 2013 - A Systematic Survey of Expression and Function of Zebrafish frizzled Genes
- All Figures
- Figures for Nikaido et al., 2013
|
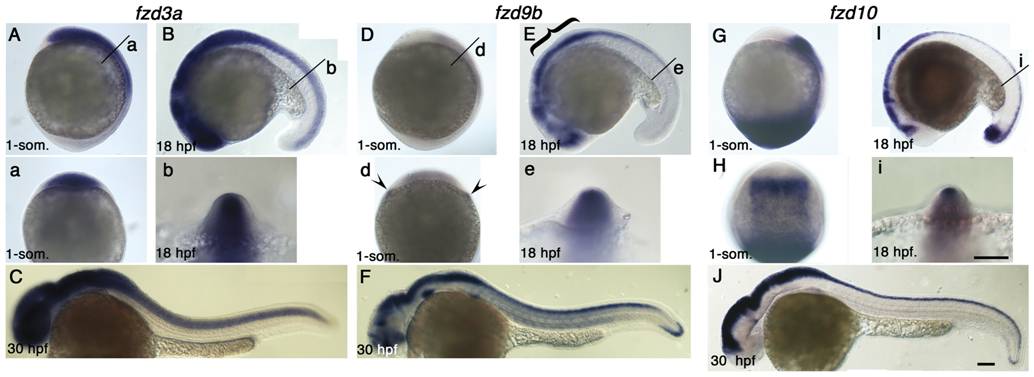
Fig. 2 Expression pattern of fzd3a, fzd9b and fzd10 at 1-som, 18 hpf and 30 hpf stages.
Name of genes are indicated on top. Panels A, D, G are left side views at 1-som. stage. Dorsal to the right. Panels B, E, I are left side views at 18 hpf stage. Dorsal to the top. Panels C, F, J are left side views at 30 hpf with anterior toward left. Panels a, b, d, e, i are optical sections at the indicated level of panels A, B, D, E, I, respectively. Panel H is dorsal view with anterior set toward top. For descriptions, see text. Arrowheads in panel d indicate expression at the edge of neural plate, but these signals seem to be underneath the ectoderm. Scale bar: 100 μm.