
Fig. 4
- ID
- ZDB-IMAGE-121025-41
- Genes
- Publication
- Ben Shoham et al., 2012 - S1P1 inhibits sprouting angiogenesis during vascular development
- All Figures
- Figures for Ben Shoham et al., 2012
|
Fig. 4
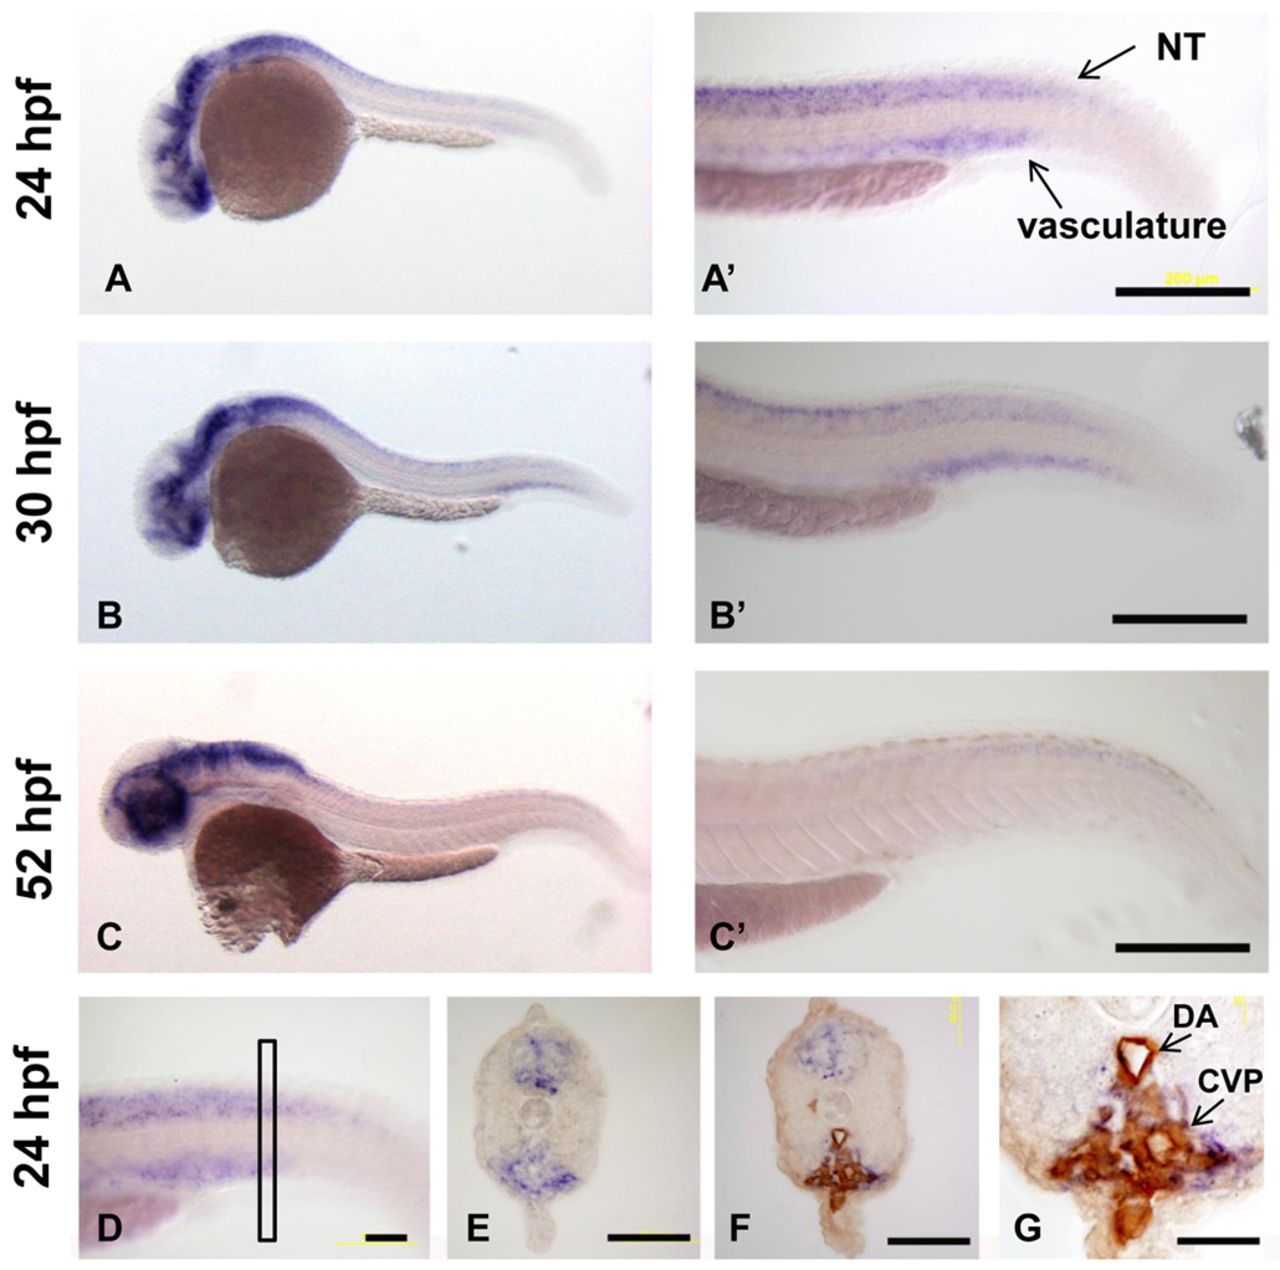
Expression profile of s1p1 during zebrafish embryonic development. (A-G) In situ hybridization for s1p1 in zebrafish embryos at 24 hpf (A,A2), 30 hpf (B,B2) and 52 hpf (C,C2). A2, B2 and C2 show magnifications of the tail area shown in A, B and C, respectively. NT, neural tube. (D) Lateral view of the tail at 24 hpf. (E) Cross-section from the rectangular area marked in D. (F) Cross-section of Tg(fli-egfp)y1 zebrafish embryo counter-immunostained with anti-GFP antibody to mark blood vessels. (G) Magnification of F; both the dorsal aorta (DA) and the caudal vein plexus (CVP) show s1p1 expression. Scale bars: in A-C2, 200 μm; in D-F, 50 μm; in G, 20 μm.