
Fig. 10
- ID
- ZDB-IMAGE-120724-11
- Genes
- Publication
- Akle et al., 2012 - F-Spondin/spon1b Expression Patterns in Developing and Adult Zebrafish
- All Figures
- Figures for Akle et al., 2012
|
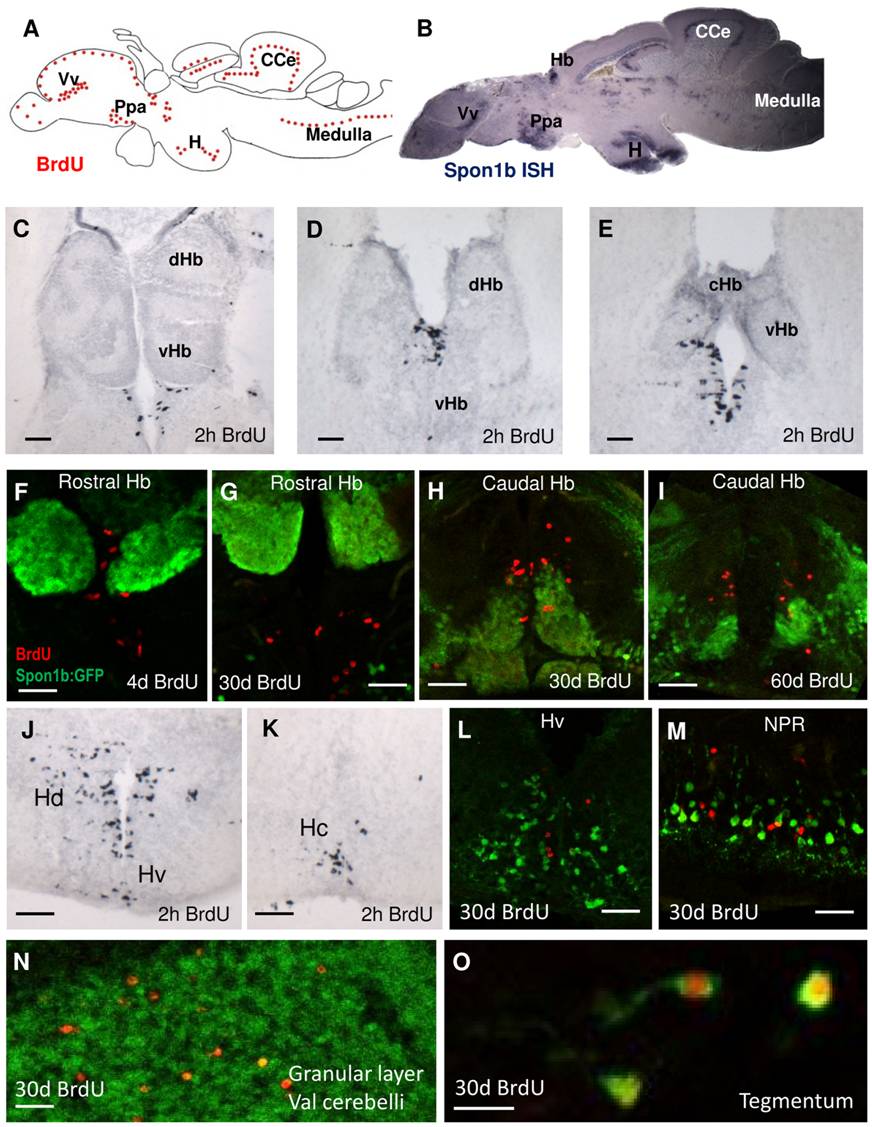
Fig. 10 Spon1b is expressed in neurogenic niches.
A. Schematic of neurogenic niches in zebrafish brain based on BrdU immunostaining and modified from Grandel et. al. (2006). Cerebellar corpus (CCe), Habenula (Hb), hypothalamic areas (H), parvocellular preoptic area (Ppa), thalamic area (T), ventral nucleus of ventral telencephalon (Vv). B. Mid-sagittal of adult zebrafish brain showing spon1b mRNA expression (in situ hybridization). Note the overlap of the spon1b-positive areas with the neurogenic niches. C-E. BrdU-positive nuclei in the habenular niche in rostral (D), and mid (E) and caudal (F) areas, 2 hours post-BrdU injection. F-I. Double immunostaining of the habenular niche, showing spon1b- (green) and BrdU- (red) positive cells, at 4d (F), 30d (G-H) and 60d (I) post BrdU-injection, showing migration of the BrdU nuclei away from the niche and into the surrounding tissue. J-K. BrdU nuclei in the ventral (J) and caudal (K) hypothalamus, Hv and Hc, respectively, 2 hours post-injection. L-M. Double immunostaining for BrdU (red) and spon1b:GFP (green) 30 days post BrdU injection in ventral hypothalamus (Hv, L), and in the nucleus of the posterior recess (NPR) in Hc (M) showing lack of co-localization. N. Double immunostaining for BrdU (red) and spon1b:GFP (green) 30 days post BrdU injection in the cerebellum. Note the BrdU-positive nuclei among the spon1b-positive fibers. O. Co-localization of BrdU (red) and spon1b:GFP (green) in cells extending long projections in the tegmentum 30 days post-BrdU injection. Scale bar C: 200 μm, D-L,N: 50 μm, M: 20 μm.