
Fig. 5
- ID
- ZDB-IMAGE-120717-26
- Genes
- Publication
- Oehlers et al., 2012 - Retinoic acid suppresses intestinal mucus production and exacerbates experimental enterocolitis
- All Figures
- Figures for Oehlers et al., 2012
|
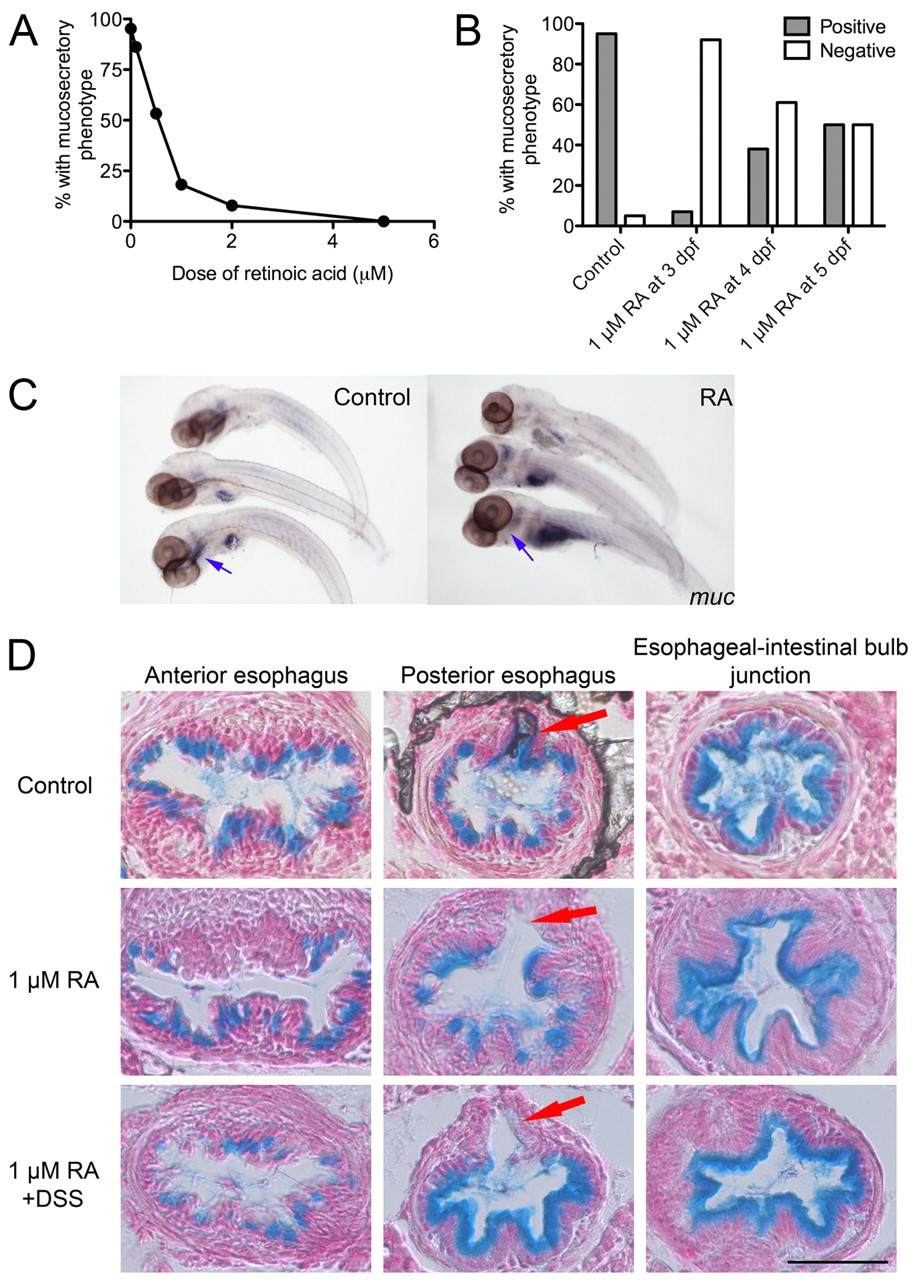
Fig. 5 Retinoic acid suppresses the DSS-induced mucosecretory phenotype. (A) Dose-response curve of the percentage of DSS-exposed larvae positive for the mucosecretory phenotype after the administration of a range of doses of RA (n≥20 per group; two biological replicates). (B) Proportion of DSS-exposed larvae positive or negative for the mucosecretory phenotype at 6 dpf after administration of RA at the day indicated. Fisher’s exact test P-values vs untreated controls: 3 dpf<0.0001, 4 dpf=0.0002, 5 dpf=0.0011; n≥20 per group, two biological replicates. (C) Whole-mount in situ hybridization detection of muc expression in the esophagus in control and RA-treated larvae. Blue arrows indicate the location of the esophagus. (D) Alcian-blue-stained esophageal sections of larvae treated with 1 μM RA and exposed to DSS. Arrows indicate the pneumatic duct. Scale bar: 50 μm.