
Fig. 2
- ID
- ZDB-IMAGE-120717-23
- Genes
- Publication
- Oehlers et al., 2012 - Retinoic acid suppresses intestinal mucus production and exacerbates experimental enterocolitis
- All Figures
- Figures for Oehlers et al., 2012
|
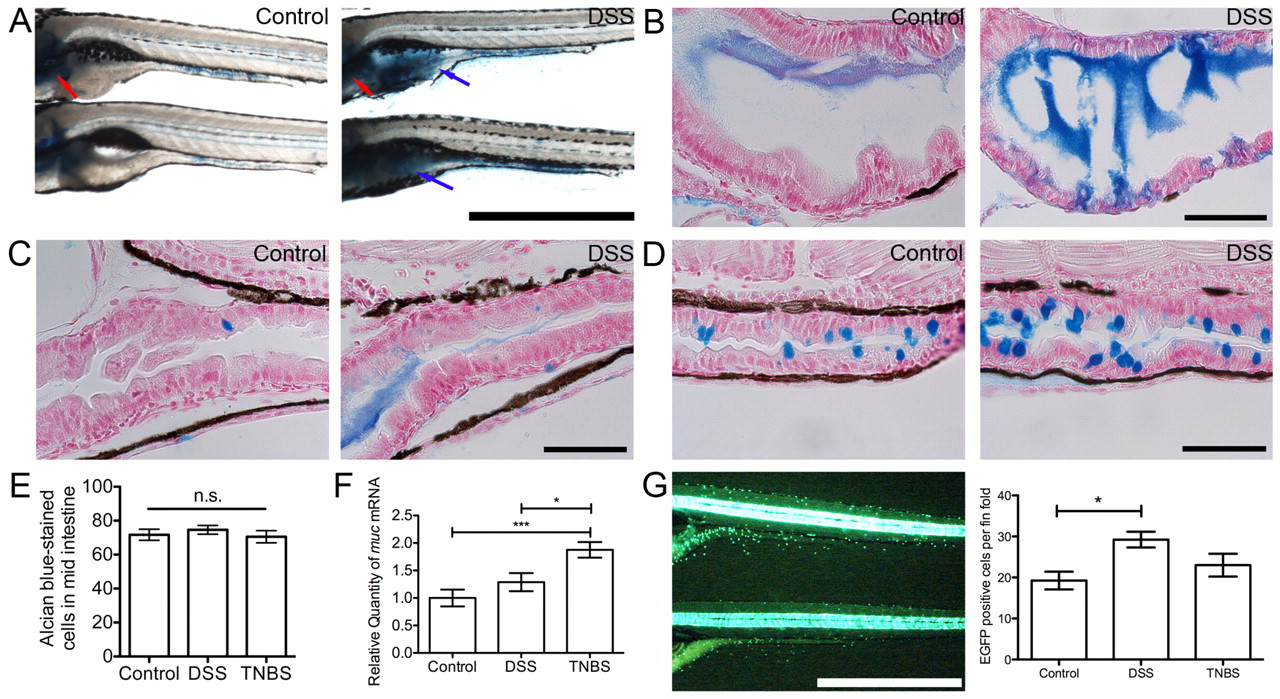
Fig. 2 DSS exposure induces a mucosecretory phenotype in zebrafish larvae. (A) Whole-mount control and DSS-exposed larvae stained with alcian blue. Blue arrows indicate intestinal bulb staining, red arrows indicate cartilage staining. Scale bar: 1 mm. (B) Longitudinal sections of intestinal bulb from control and DSS-exposed larvae, stained with alcian blue. Scale bar: 50 μm. (C) Longitudinal sections of the anterior-mid intestinal junction at the posterior edge of the swim bladder from control and DSS-exposed larvae, stained with alcian blue. Scale bar: 50 μm. (D) Longitudinal sections of the mid-distal intestinal junction from control and DSS-exposed larvae, stained with alcian blue. Scale bar: 50 μm. (E) Enumeration of mid intestinal goblet cells by manual counting (n≥28 per group; two biological replicates). (F) Quantitative PCR analysis of muc expression in control, DSS- and TNBS-exposed larvae (n=4). (G; left) Live image of 6-dpf Tg(kita:GAL4, UAS:EGFP) larvae; fin fold was defined as epidermis immediately ventral to the intestine. Scale bar: 1 mm. (G; right) Enumeration of GFP-expressing skin goblet cells on the fin fold of individual larvae (n≥12 per group; two biological replicates). Error bars represent s.e.m.; *P<0.05, ***P<0.0001 as determined by ANOVA.