
Fig. 1
- ID
- ZDB-IMAGE-120525-15
- Genes
- Publication
- Telfer et al., 2012 - neb: a zebrafish model of nemaline myopathy due to nebulin mutation
- All Figures
- Figures for Telfer et al., 2012
|
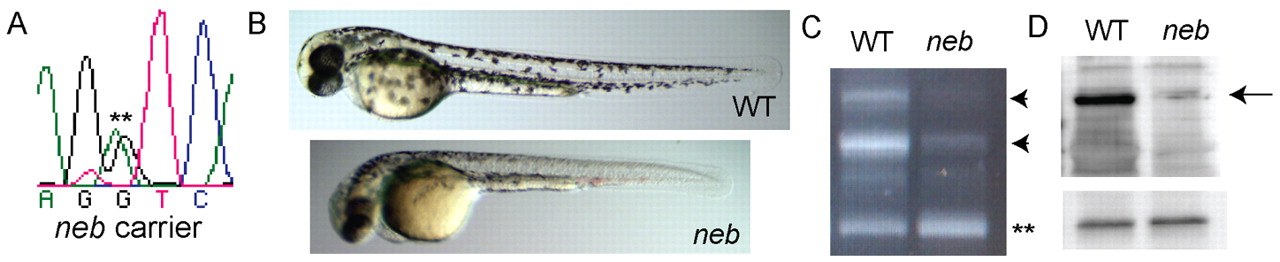
Fig. 1
Characterization of neb zebrafish. (A) DNA sequencing of neb adult carriers revealed a heterozygous sequence change (G>A) at IVS43+1 (**). (B) Live visualization of neb embryos and control (WT) littermates at 2 dpf. neb embryos are smaller and have thin bodies and tails. Genotyping confirmed that phenotypically abnormal embryos were homozygous for the G>A sequence change. (C) RT-PCR using exon 42–44 spanning primers of RNA extracted from pools of WT and neb embryos. WT fish have 2 major bands (arrowheads), a middle band that corresponds to the predicted size of exons 42–44 and a higher molecular weight band. neb zebrafish have diminished expression of these bands and instead have increased expression of a small band (**) with a size equal to that of exons 42–44 and excluding exon 43. Sequencing of this band confirmed that it lacked exon 43. (D) Western blot analysis of protein extracted from WT and neb embryos. Upper blot: with an anti-N-terminal Nebulin antibody, WT embryos had a single dominant band of very high molecular weight. This band was absent from neb embryos (arrow). Lower blot: confirmation of protein sample integrity and equal loading using anti-GAPDH antibody.