
|
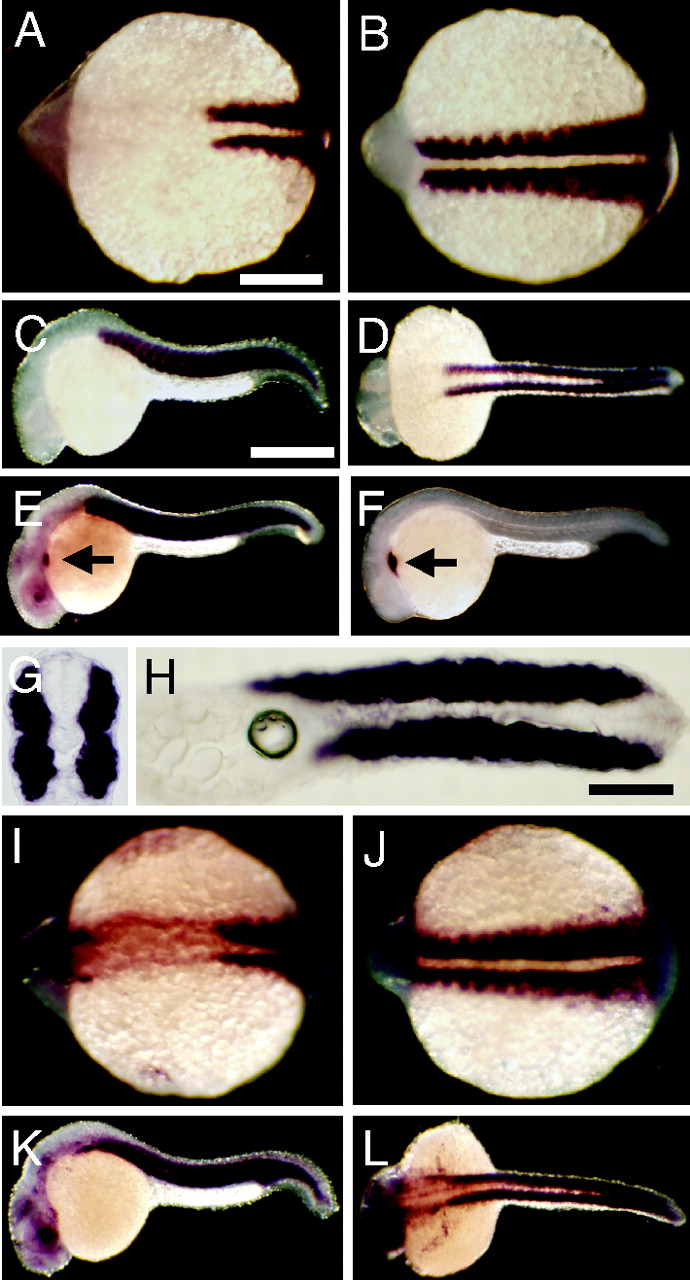
Fig. 2
Temporal and spatial expression of Hsp90α1 and Hsp90α2 in zebrafish embryos. (A–D) Muscle-specific expression of Hsp90α1 in somites and skeletal muscles at 13 (A and B) and 24 hpf (C and D). (A and B) Dorsal view of anterior (A) and posterior (B) regions of a 13-hpf embryo. (C and D) Side (C) and dorsal (D) view of a 24-hpf embryo. The enzymatic reaction was carried out for 3 h during the whole-mount in situ hybridization. (E and F) Longer in situ staining (12 h) shows the cardiac expression of Hsp90α1 (arrow in E) in comparison with the cardiac muscle specific expression of myosin light chain (F). A weak staining of Hsp90α1 was also found in the brain and eye regions (E). (G and H) Cross (G) and horizontal (H) sections showing the muscle-specific expression of Hsp90α1 in zebrafish embryos at 24 hpf. (I–L) Expression of Hsp90α2 in somites, skeletal muscles and other tissues at 13 (I and J) and 24 hpf (K and L). In addition to muscle expression, Hsp90α2 expression was also detected in the head and eye regions (I). The enzymatic reaction was carried out for12 h during the whole-mount in situ hybridization. (Scale bars: A, 250 μm; C, 150 μm; and H, 50 μm.)