
Fig. 8
- ID
- ZDB-IMAGE-120315-70
- Genes
- Antibodies
- Publication
- Shen et al., 2012 - The cytokine macrophage migration inhibitory factor (MIF) acts as a neurotrophin in the developing inner ear of the zebrafish, Danio rerio
- All Figures
- Figures for Shen et al., 2012
|
Fig. 8
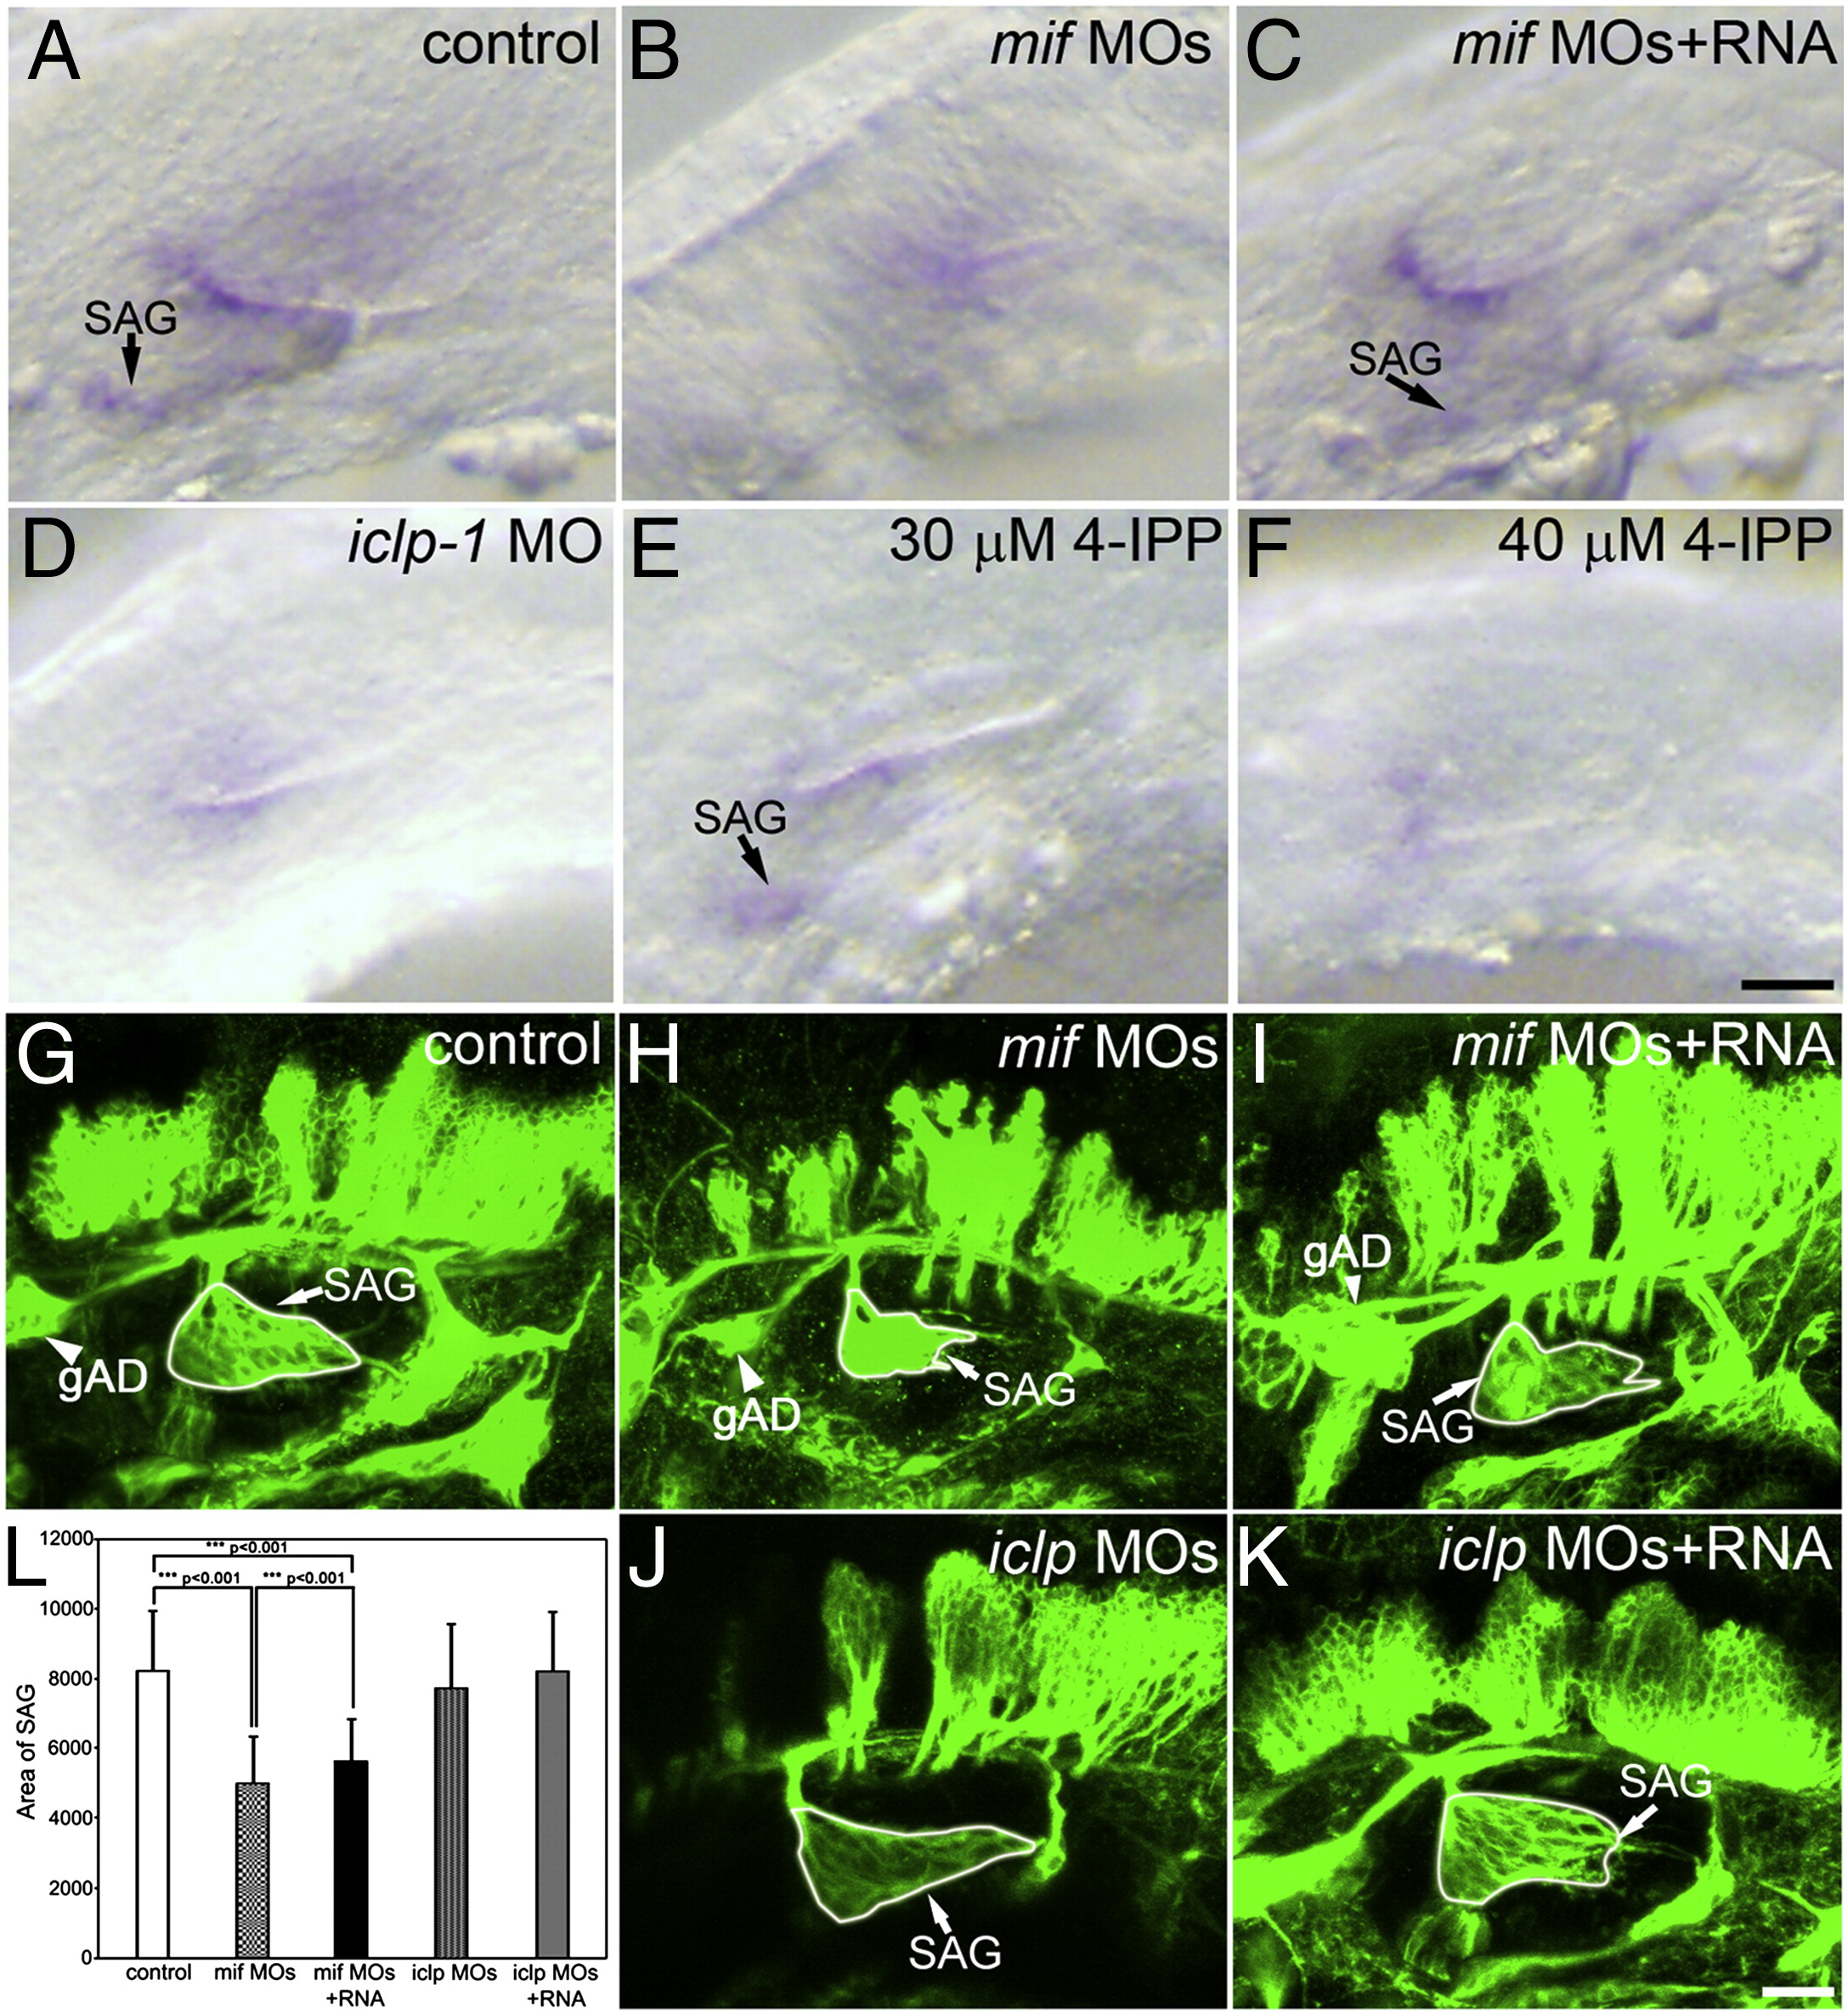
Statoacoustic ganglion in the mif, iclp morphants and 4-IPP treated embryos. (A–F) Whole mount in situ hybridization of embryos with an nkx5.1 probe, showing the otic vesicle and SAG at 32 hpf. (A) control embryo; (B) mif morphant; (C) mif morphant with RNA; (D) iclp1 morphant; (E, F) 4-IPP treated (E: 30 μM, F: 40 μM) embryos. (G–K) zn-5 staining in 48-hpf embryos. (G) control; (H) mif morphant; (I) mif morphant with capped mif RNAs; (J) iclp morphant; (K) iclp morphant with capped iclp RNAs. The white line outlines the SAGs. Note other cranial ganglia were also smaller in the mif morphants than the control. gAD: anterodorsal LL ganglia. Scale bar: 25 μm. (L) Comparison of size of the SAG with various treatments. Control embryos (n = 30), mif MOs (n = 14), mif MOs + RNA (n = 12), iclp MOs (n = 17), and iclp MOs + RNA (n = 15).
Reprinted from Developmental Biology, 363(1), Shen, Y.C., Thompson, D.L., Kuah, M.K., Wong, K.L., Wu, K.L., Linn, S.A., Jewett, E.M., Shu-Chien, A.C., and Barald, K.F., The cytokine macrophage migration inhibitory factor (MIF) acts as a neurotrophin in the developing inner ear of the zebrafish, Danio rerio, 84-94, Copyright (2012) with permission from Elsevier. Full text @ Dev. Biol.