
|
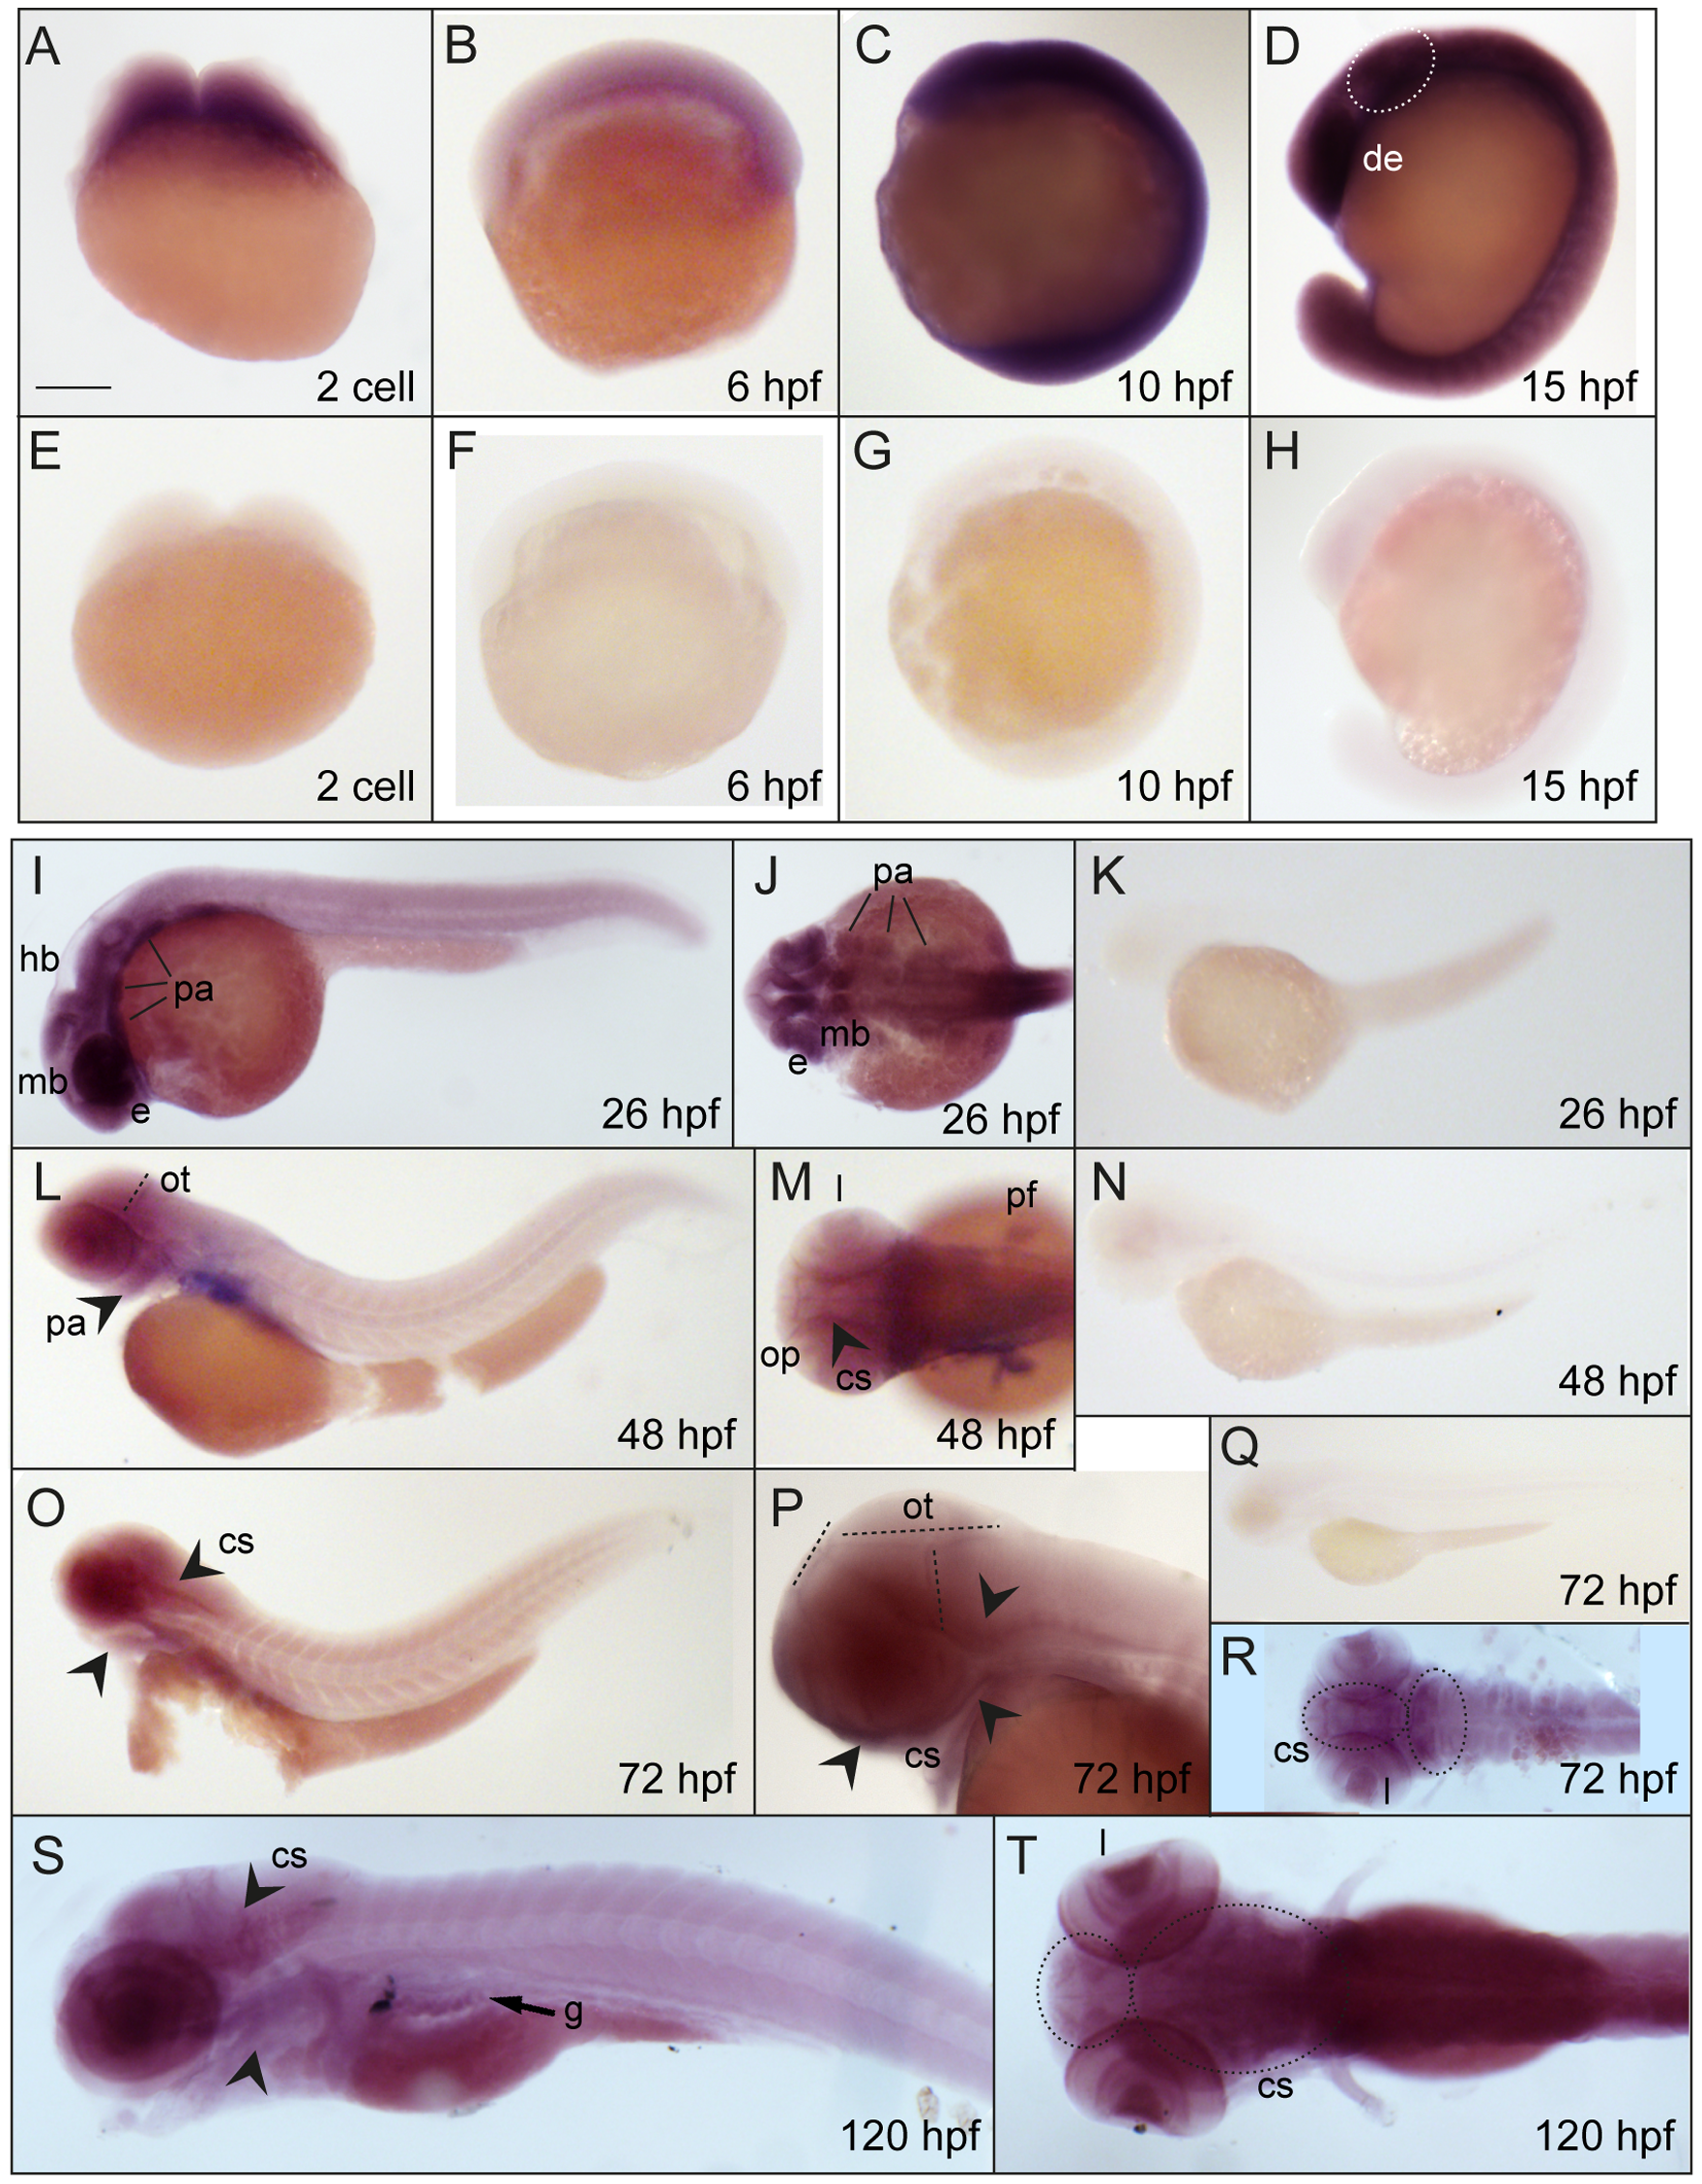
Fig. 2
Developmental expression pattern of tcof1 by whole mount in situ hybridization.
Lateral (A–I, K, L, N–Q, S) and dorsal (J, M, R and T) views (anterior regions to the left) of zebrafish embryos hybridized with anti-sense (A–D, I, J, L, M, O, P, and R–T) or sense (E–H, K, N and Q) zebrafish tcof1 probes. The following stages were analyzed: 2-cell stage (A and E), 6 hpf (B and F), 10 hpf (C and G), 13 hpf (D and H), 24 hpf (I–K), 48 hpf (L–N), 72 hpf (O–R), and 120 hpf (S–T). Abbreviations: cs, craniofacial structures; de, diencephalic region; e, eye; g, gut; mb, midbrain; hb, hindbrain; l, lenses; op, olfactory pits; ot, optic tectum; pa, pharyngeal arches; pf, pectoral fin buds. Scale bar: 180 μm for A–H; 210 μm for I, J and P; 266 μm for K; 320 μm for L, M and R; 380 μm for N, O, and S–T; 530 μm for Q.