
Fig. 2
- ID
- ZDB-IMAGE-111220-10
- Genes
- Antibodies
- Publication
- Kimmel et al., 2011 - Requirement for Pdx1 in specification of latent endocrine progenitors in zebrafish
- All Figures
- Figures for Kimmel et al., 2011
|
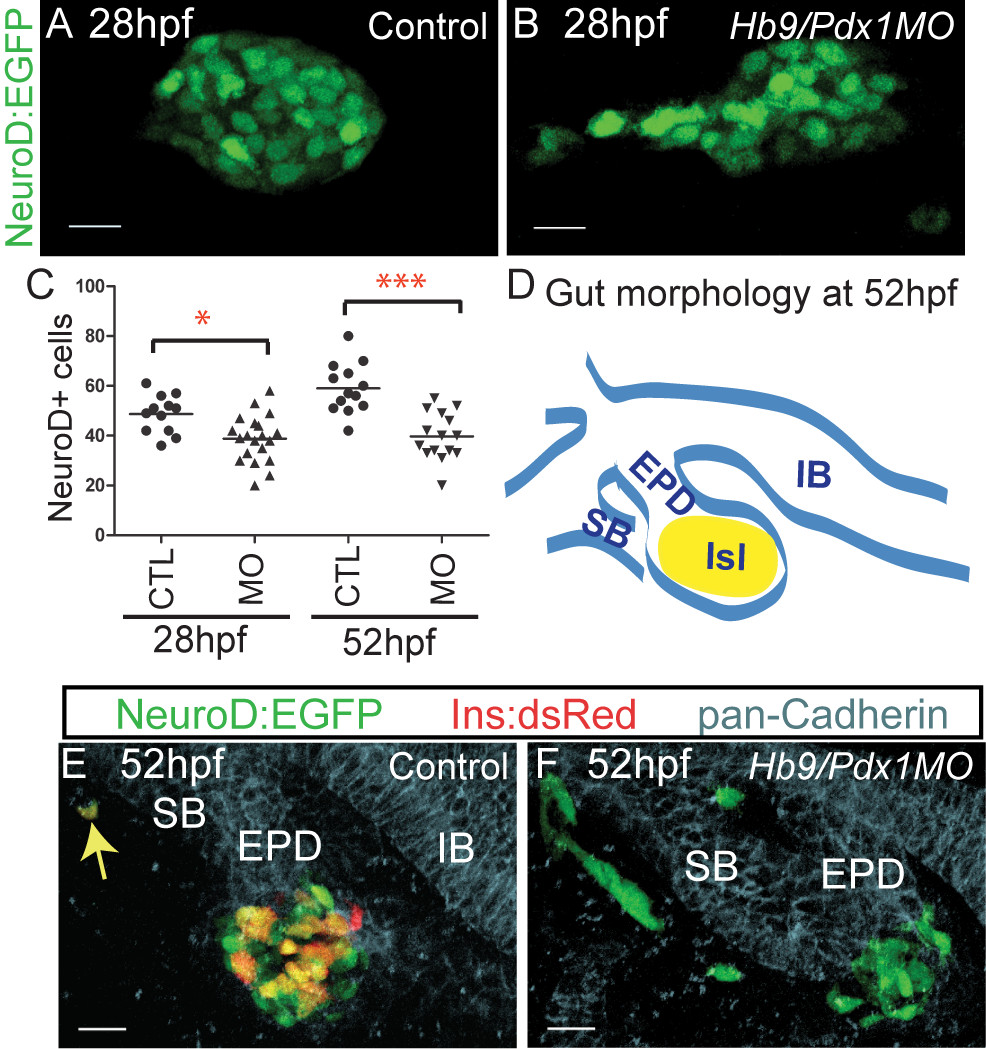
Fig. 2 Disrupted precursor specification and differentiation in hb9/pdx1 double morphants. (A,B) Projections of confocal image stacks of native enhanced green fluorescent protein (EGFP) expression in control uninjected and in hb9/pdx1 morpholino injected TgBAC(NeuroD:EGFP)nl1 embryos at 28 h post fertilization (hpf). In morphants, the clustering of EGFP labeled cells is disrupted (B) and the number of EGFP expressing cells is reduced as compared to controls (C). By 52 hpf, NeuroD:EGFP cell numbers have increased in control embryos, but not changed in the morphants ((C), *P < 0.05, ***P < 0.001 as determined by one-way analysis of variance (ANOVA) with Bonferroni′s post test). (D) Schematic depicting overall gut morphology in 52 hpf embryos. EPD, extrapancreatic duct; IB, intestinal bulb; ISL, islet; SB, swim bladder. (E,F) Confocal image projections of control uninjected (E) and hb9/pdx1 morpholino injected (F) TgBAC(NeuroD:EGFP)nl1;Tg(ins:dsRed)m1018 embryos at 52 hpf that were costained with antibodies against pan-cadherin (light blue) to outline epithelial structures. In control embryos, EGFP+ and EGFP+/DsRed+ cells are mainly found in the islet. A rare EGFP+/DsRed+ cell is seen in a distal location (E, arrow). In double morphants, few to no EGFP/DsRed-expressing cells can be detected and many EGFP+ cells are located at ectopic positions outside the developing gut epithelium (F). Scale bar = 15 μM in all panels. All embryos are shown from ventral view, anterior to the left.